
In the modern business landscape, the era of simply balancing the ledger books at the end of the month and blindly celebrating residual profits is long dead. Today, successful corporate management resembles a rigorous, high-precision science—one dedicated to tracking the exact micro-gaps between meticulously pre-engineered benchmarks and real-world execution.
We stand at a critical strategic crossroads. Companies can either drift aimlessly without financial anchor points, reacting defensively to volatile market waves after the damage is already done, or they can arm themselves with Variance Analysis as a powerful weapon to proactively dictate market outcomes.
Achieving sustainable corporate growth amid relentless, hyper-competitive global markets demands a playbook that goes far beyond generic, blunt cost-cutting. Smart leadership requires a sophisticated financial vision. This means establishing scientifically derived Standard Costing as an unshakeable organizational foundation, examining performance discrepancies through a microscope, and rapidly translating those root causes into macro-level corporate strategies across marketing, manufacturing, and global procurement.
1. Demystifying Financial Discrepancies through Everyday Analogies
To grasp this concept intuitively, think of variance analysis as the exact financial equivalent of tracking a strict fitness and weight-loss regimen. Imagine you set a definitive personal benchmark to lose 6 pounds this month. When you step on the digital scale at the end of the four weeks, you discover you only lost 2 pounds.
Instead of throwing your hands up in frustration, you break down the failure scientifically. Did you fall short because your caloric intake was too high (the financial equivalent of a Price Variance), or did you fail because your actual time spent working out on the treadmill was highly inefficient (an Efficiency Variance)? Pinpointing that exact root cause allows you to intelligently recalibrate your behavior for the upcoming month.
- Variance: This represents the distinct, measurable chasm between your initial premeditated blueprint and what actually manifested in reality. It is identical to looking at an academic report card and calculating the raw mathematical delta between your target GPA and your actual grade.
- Analysis: This is the systematic process of dissecting that delta into granular, actionable components to isolate the precise catalysts of failure or success. It means refusing to merely grieve a poor score, choosing instead to audit whether you skimped on preparatory lectures or neglected your comprehensive review sessions.
- Core Meaning: It is a foundational pillar of managerial accounting wherein an enterprise systematically juxtaposes pre-established corporate targets against actual operational performance. This scientific cross-examination uncovers precisely where capital was overutilized or conserved, revealing the underlying structural explanations.
2. Industry Pairings: Strategic Cost Management Across Core Sectors
The operational execution of this accounting framework shifts dynamically based on an enterprise’s core revenue model and industry classification.
Manufacturing and Consumer Electronics (Material Cost Control Focus)
In heavy production sectors led by global giants like Apple, Samsung, Tesla, or General Motors, the market price of foundational raw inputs—such as semiconductors, display panels, lithium, and aluminum—fluctuates violently on a daily basis.
For these firms, engineers and accountants determine a strict standard cost for every single unit rolling off the assembly line. By running deep monthly checks to compare planned material expenditures against the real dollars spent on the factory floor, these enterprises maximize production throughput and insulate their gross margins from supply chain shocks.
Platform Services and Digital Ecosystems (Labor and Marketing Focus)
Conversely, in digital-first platform giants like Uber, Netflix, DoorDash, or Google, physical raw materials are practically non-existent. Instead, their financial lifelines revolve around software engineer payrolls and massive user-acquisition budgets.
These organizations execute variance analysis by benchmarking projected performance-marketing spending against actual new subscriber conversion rates. If the customer acquisition cost spikes unexpectedly, corporate finance teams dissect the efficiency parameters immediately to evaluate whether the digital ad spend is yielding a viable return on investment.
3. The Corporate Health Audit and Accountability Blueprint
Variance analysis is far more than a basic, passive accounting exercise; it acts simultaneously as an organization’s comprehensive medical checkup and its ultimate corrective study guide.
The Diagnostic Methodology
The system categorically rejects superficial observations like, “Our expenses ran high this quarter.” Instead, it applies a sharp, surgical scalpel to total cost overruns. It isolates whether an overage stemmed strictly from external market forces, such as a supplier hiking raw commodity rates (Price Variance), or if it was driven by internal operational failures, like assembly line friction and employee training gaps wasting precious material (Efficiency Variance).
Strategic Performance Evaluation
This methodology functions as an objective, transparent framework for corporate accountability. It provides the chief executive officer with explicit, unvarnished clarity regarding which departmental leaders deserve financial bonuses for stellar performance, and which operational managers need to be brought to the table to collaboratively address systemic inefficiencies.
4. The Dangerous Blind Spots of Managing Without Variance Tracking
Operating a contemporary enterprise without integrating a rigorous variance tracking system is the corporate equivalent of piloting a commercial aircraft through a heavy storm with zero dashboard instruments.
[ Traditional Accounting ]  ──►  Bluntly observes past spending data.
                                 (Reactive & Blind to Root Causes)

[ Variance Analysis ]       ──►  Isolates External Price Shifts vs. Internal Waste.
                                 (Proactive & Precision Controlled)
- The Bleeding of Invisible Capital: If overall quarterly expenditures jump by $100,000 compared to the historical baseline, management remains entirely oblivious to the true cause without variance modeling. The firm cannot distinguish whether global inflation pushed raw component prices up or if factory workers are discarding defective materials, allowing severe operational waste to rot the bottom line unchecked.
- Misplaced Executive Blame: When macro commodity prices skyrocket globally, an un-analyzed cost spike might tempt an unguided executive to harshly penalize an incredibly efficient plant manager. This creates severe cultural resentment, punishing internal staff for external market anomalies that were completely outside of their operational control.
- The Vicious Cycle of Defective Forecasting: Lacking an empirical, objective understanding of the firm’s true baseline capabilities ensures that the executive committee will inevitably build the subsequent fiscal year’s corporate budgets on highly flawed, inaccurate assumptions.
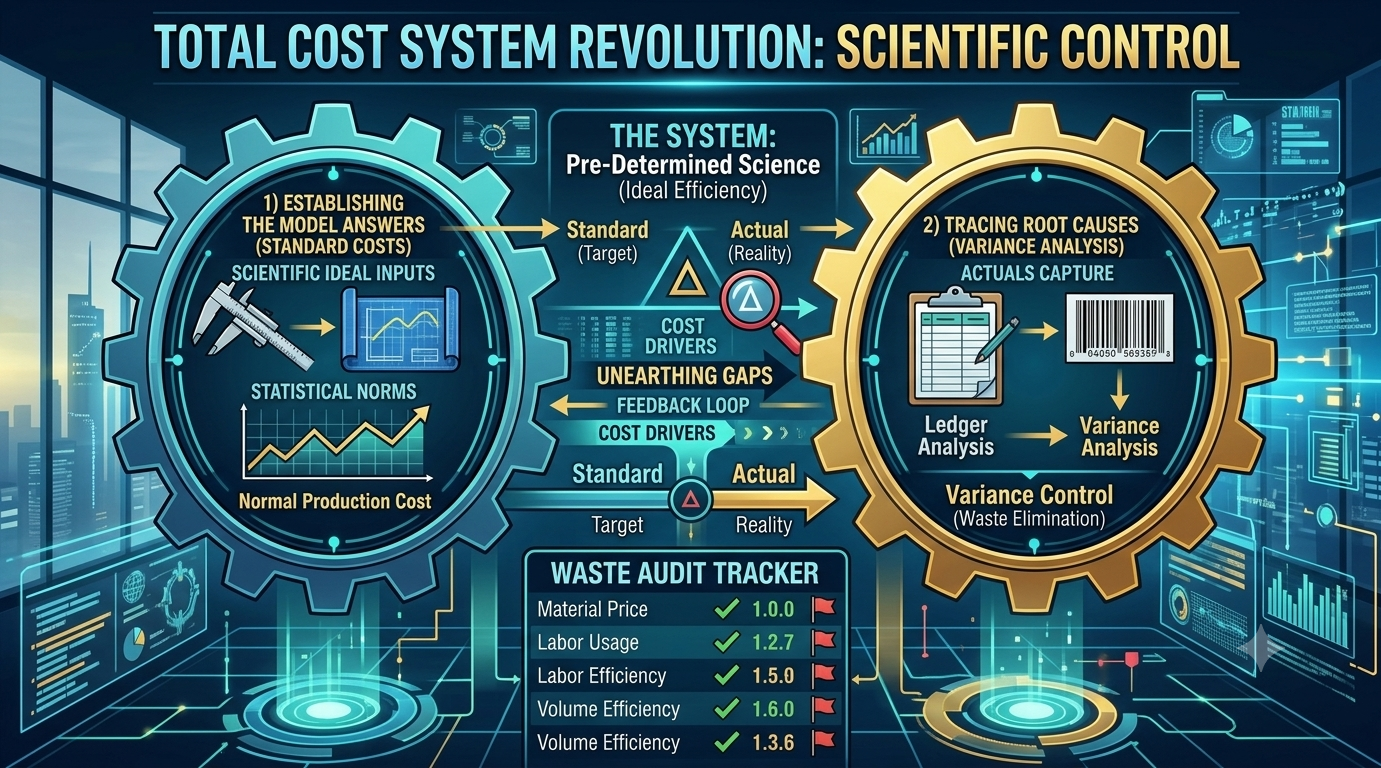
5. The Five-Step Sequential Variance Analysis Process
Executing a world-class variance analysis program requires adherence to a highly structured, continuous operational lifecycle:
| Process Step | Operational Objective (Left-Aligned Content) | Strategic Value & Implementation Insights (Left-Aligned Content) |
| 1. Setting Standards | Establish rigid, idealized benchmark points for raw material metrics and labor hours. | Serves as the ultimate corporate blueprint; requires synchronized collaboration between industrial engineers and corporate financial planners. |
| 2. Gathering Actuals | Compile comprehensive real-world expenditure data and total direct labor hours utilized. | Requires real-time enterprise resource planning software integration to capture precise shop-floor data. |
| 3. Total Variance | Compute the baseline mathematical delta between total budgeted capital and actual expenditures. | Offers a high-level operational pulse check to determine if the company overachieved or underachieved globally. |
| 4. Deconstruction | Mechanically split the total variance into isolated price, rate, efficiency, and volume vectors. | The core analytical engine where accountability is determined and external market factors are separated from internal performance. |
| 5. Strategic Feedback | Execute immediate operational pivots, such as renegotiating supply contracts or deploying training. | Closes the loop by transforming raw financial accounting metrics into proactive, agile corporate defense mechanisms. |
6. Favorable vs. Unfavorable Metrics and Year-End Ledger Reconciliation
Once the computational phase is complete, the resulting financial deltas are classified into two distinct operational categories, both of which must be structurally reconciled at the conclusion of the fiscal year.
The Two Faces of Financial Variation
- Favorable Variance: This occurs when the actual realized expenses are lower than the engineered standard costs. Because this delta directly bolsters the firm’s net income, it represents a positive financial outcome for the enterprise.
- Unfavorable Variance: This manifests when actual production costs surpass standard benchmarks. This outcome acts as a direct drag on corporate profitability, flashing a warning signal across the executive dashboard.
Year-End Closing and Clean-Up Methodologies
To ensure the integrity of public financial statements, these temporary variance accounts must be systematically cleared out at year-end using one of three standard GAAP/IFRS approaches:
- Cost of Goods Sold Direct Adjustment: If the calculated variance is immaterial to the overall financial scope of the business, accountants bypass complex mathematical distributions. They simply dump or subtract the entire variance directly into or out of the Cost of Goods Sold ledger line. Unfavorable deltas increase the cost baseline, while favorable ones immediately lower it.
- Proportional Allocation Method: When the variance represents a massive, highly material sum of capital, a blunt single-ledger drop is unacceptable. The total variance must be split proportionally and distributed across remaining inventory stages—specifically Work-in-Process, Finished Goods, and Cost of Goods Sold—reflecting exact balances.
- Non-Operating Income and Expense Treatment: If an extreme cost blowout occurs due to a catastrophic, completely non-recurring anomaly—such as a major factory fire or an unprecedented natural disaster—it cannot be classified as a standard cost of manufacturing. The financial delta is segregated entirely from core operational costs and reported plainly as a non-operating loss to preserve transparency for Wall Street investors.
7. Psychological and Strategic Blind Spots in Variance Interpretation
While hard financial metrics do not lie, executives who lack sophisticated analytical depth frequently fall into dangerous cognitive traps when reading variance reports.
The Illusion of Favorable Metrics
Suppose a corporate procurement division secures an incredibly cheap contract for steel, generating a massive, highly praised favorable price variance. However, if that bargain steel is highly brittle, causing production machinery to jam and triggering an explosion of product defects on the assembly line, the factory will suffer a catastrophic, unfavorable efficiency variance.
Focusing entirely on a single departmental victory while ignoring the downstream operational ecosystem can lead an organization straight to bankruptcy.
Interconnected Operational Realities
Corporate cost structures are deeply tied together in a complex web. Hiring highly skilled, premium-wage technicians triggers an immediately unfavorable labor rate variance. Yet, those elite workers operate with such speed and flawless precision that they drastically minimize material waste and slash production times, yielding massive favorable efficiency variances.
Management must look at the big picture rather than scolding a department in isolation.
Isolating Controllable vs. Uncontrollable Dynamics
If global energy markets collapse or international shipping tariffs skyrocket due to geopolitical friction, a plant manager can do absolutely nothing to contain those soaring input costs. This is an entirely uncontrollable variance.
Conversely, if a messy, disorganized warehouse floor causes workers to routinely misplace or damage raw materials, it represents a highly controllable variance. True leadership focuses its strategic attention exclusively on fixing internal, controllable operational flaws.
Conclusion: Key Takeaways
- Move Beyond Hindsight Accounting: Modern corporate success requires a proactive pivot from historical bookkeeping to real-time variance deconstruction.
- Isolate the Root Causes: Never judge a financial overrun on surface numbers alone; surgically separate external price shocks from internal operational inefficiencies.
- Contextualize the Metrics: Guard against the trap of optimizing a single department’s metrics at the expense of total organizational product quality.
- Drive Strategic Accountability: Leverage variance reports not as a punitive disciplinary tool, but as an empirical pacemaker to build long-term corporate resilience.
* This article was created in collaboration with Google Gemini AI. The author independently created, reviewed, and edited the content to ensure professional quality.