
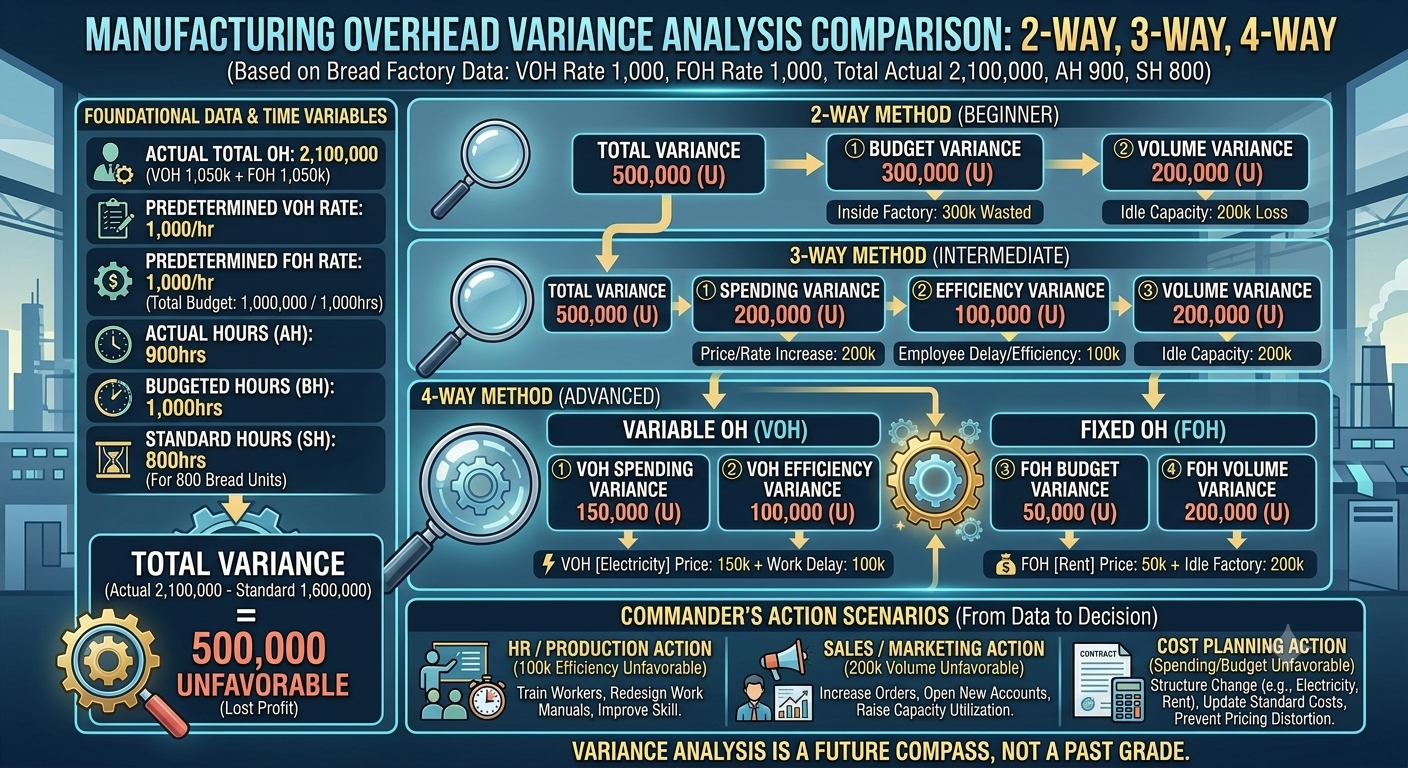
If the complex formulas and conceptual frameworks of manufacturing overhead variance analysis (the 2-way, 3-way, and 4-way methods) have ever left you feeling overwhelmed, you are not alone. Let us simplify this by looking at the “report card” of a bakery. By comparing the original plan (standard) with the actual receipts at the end of the month, we can track precisely where the budget leaked, depending on the “magnifying glass” of analysis we use.
Foundational Data for Variance Analysis
Before diving into the formulas, we must align the bakery’s original plan with the actual outcomes:
- Variable Overhead Rate: $1,000 per machine hour.
- Fixed Overhead Rate: $1,000 per machine hour (Total budget $1,000,000 divided by 1,000 hours).
- Actual Total Overhead Incurred: $2,100,000 (Assuming $1,050,000 variable and $1,050,000 fixed).
- Three Core Time Variables:
- Actual Hours (AH): Actual machine runtime = 900 hours.
- Budgeted Hours (BH): Planned capacity at the start of the year = 1,000 hours.
- Standard Hours (SH): Hours allowed for the actual production of 800 loaves of bread = 800 hours.
1. Summary of Overhead Variance Analysis
Regardless of the method used, the total variance (Actual Cost $2,100,000 – Applied Standard $1,600,000 = $500,000 Unfavorable) remains the same. Here is how that variance is broken down by the precision of your analysis.
- 2-Way Variance: Budget Variance ($300,000 U) and Volume Variance ($200,000 U).
- 3-Way Variance: Spending Variance ($200,000 U), Efficiency Variance ($100,000 U), and Volume Variance ($200,000 U).
- 4-Way Variance: Variable Spending Variance ($150,000 U), Variable Efficiency Variance ($100,000 U), Fixed Budget Variance ($50,000 U), and Fixed Volume Variance ($200,000 U).
Note: “Unfavorable” (U) indicates that actual costs exceeded the budget, negatively impacting company profit.
2. Detailed Calculation Methods
2-Way Variance
This approach segments the analysis into two broad categories: internal operational spending and external capacity utilization.
- Budget Variance: Actual Cost – (Fixed Budget + (AH × Variable Rate)) = $300,000 U.
- Volume Variance: (BH – SH) × Rate = $200,000 U.
3-Way Variance
This method isolates the inefficiency caused by labor or machine delays from the general spending variance.
- Spending Variance: Budget Variance – Efficiency Variance = $200,000 U.
- Efficiency Variance: (AH – SH) × Variable Rate = $100,000 U.
- Volume Variance: $200,000 U.
4-Way Variance
The most precise method, which separates variable costs (electricity) from fixed costs (rent) entirely.
- Variable Spending Variance: Actual Variable Cost – (AH × Variable Rate) = $150,000 U.
- Variable Efficiency Variance: (AH – SH) × Variable Rate = $100,000 U.
- Fixed Budget Variance: Actual Fixed Cost – Fixed Budget = $50,000 U.
- Fixed Volume Variance: Fixed Budget – Applied Fixed Overhead = $200,000 U.
3. Comparison of Variance Analysis Techniques
| Perspective | Advantages | Disadvantages |
| 2-Way Analysis | Simple to execute and understand at a high level. | Lacks the detail to pinpoint specific operational causes. |
| 3-Way Analysis | Clearly separates spending from efficiency issues. | Still aggregates fixed and variable cost behaviors. |
| 4-Way Analysis | Offers the most granular view of cost drivers. | Requires more time and sophisticated data gathering. |
4. Strategic Actions for Management
Variance analysis is not merely about writing a report; it is a catalyst for operational change.
- Operations & HR Action (Efficiency Variance): Since 800 loaves required 100 hours beyond the standard, this suggests a need for better operator training or machine maintenance.
- Sales & Marketing Action (Volume Variance): A volume variance of $200,000 indicates that the factory under-utilized capacity due to lower-than-expected demand. The focus should be on aggressive marketing or new client acquisition rather than blaming production staff.
- Cost Planning Action (Spending/Budget Variance): External factors like rising utility costs or rent hikes are often uncontrollable. If these increases are structural, management must update standard cost benchmarks to ensure accurate pricing and profitability forecasting.
Conclusion: Key Takeaways
- The Compass for Profitability: Variance analysis is a forward-looking compass that helps management steer the business, not just a scorecard to assign blame.
- Choose Your Precision: While 2-way analysis is excellent for general oversight, 4-way analysis is indispensable for manufacturers needing to distinguish between controllable inefficiency and uncontrollable market shifts.
- Actionable Insights: Always link your numerical findings to specific departments—HR for efficiency, Sales for volume, and Finance for budget benchmarks—to drive meaningful organizational improvement.
* This post was created in collaboration with Google Gemini AI. The author independently created, reviewed, and edited the content to ensure professional quality.