
Now that we have established the blueprint through standard costing, it is time to take our actual performance report and inspect it under a microscope to identify exactly where money is “leaking.” This process is known as Variance Analysis.
Cost analysts do not simply look at the total variance figure. To prescribe the right solution, they must pinpoint the culprit: “Did we suffer a loss because raw materials became expensive, or because staff accidentally wasted them?” Below, we break down the variance analysis techniques for the three primary cost elements.
1. Direct Materials Variance: Price vs. Quantity
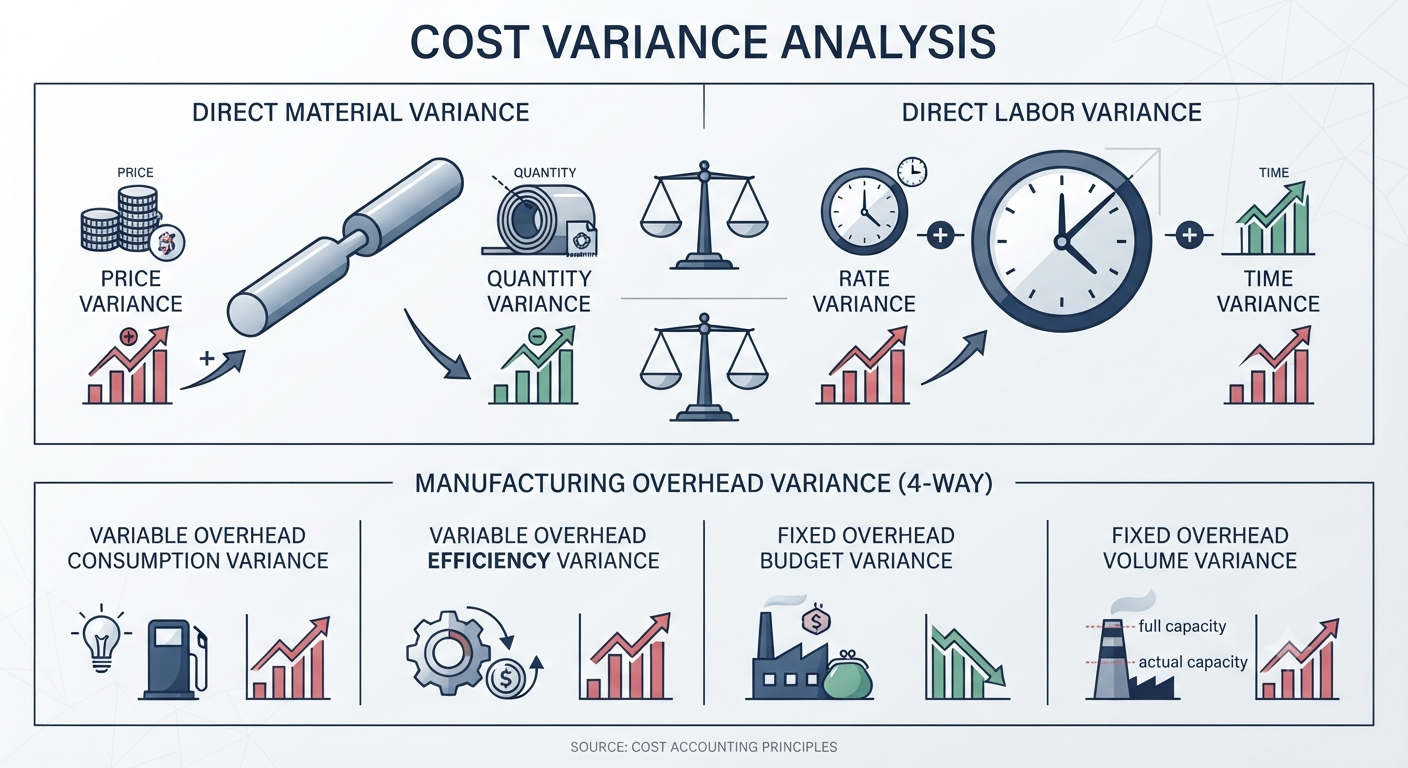
The total variance in direct materials is split into Price Variance (responsibility of the purchasing department) and Quantity/Efficiency Variance (responsibility of the production department).
| Variance Type | Definition | Common Causes |
|---|---|---|
| Price Variance | Analyzes whether raw materials were purchased above or below the standard price. | Supplier price hikes (unfavorable), bulk purchase discounts (favorable). |
| Quantity Variance | Analyzes whether more or less material was used than the standard requirement. | Worker inexperience leading to waste (unfavorable), improved machine efficiency (favorable). |
2. Direct Labor Variance: Rate vs. Speed
The total variance in direct labor is split into Rate Variance (HR/labor policy) and Efficiency Variance (field productivity).
| Variance Type | Definition | Common Causes |
|---|---|---|
| Rate Variance | Analyzes the difference between actual wages paid and the standard wage rate. | Overtime premiums (unfavorable), using lower-cost temporary staff (favorable). |
| Efficiency Variance | Analyzes whether the actual time taken to produce a product was faster or slower than standard. | Machine breakdowns leading to idle time (unfavorable), highly skilled work finishing early (favorable). |
3. Manufacturing Overhead Variance: The Mystery of Factory Maintenance
Manufacturing overhead is challenging to analyze because it mixes fixed costs (rent) and variable costs (electricity). Scholars and practitioners use several methods—2-way, 3-way, and 4-way analysis—depending on the required precision.
Understanding the Core Differences
- Variable Overhead Variance: Can be broken down into spending (price) and efficiency (time) variances.
- Fixed Overhead Variance: Since these costs exist regardless of production levels, we use Budget Variance (actual vs. planned spending) and Volume (Capacity) Variance (the effect of factory utilization rates).
Comparison of Analysis Methods
- 2-Way Analysis: Splits the variance into Budget Variance (controllable costs) and Volume Variance (fixed cost absorption due to production volume). This is ideal for quick, high-level reporting.
- 3-Way Analysis: Breaks the 2-way “Budget Variance” into Spending Variance (pure price changes) and Efficiency Variance (wastage due to labor speed). This is the standard for most manufacturing firms.
- 4-Way Analysis: The most precise method, treating variable and fixed overheads as entirely separate categories to calculate Variable Spending/Efficiency Variances and Fixed Budget/Volume Variances. This is typically used in advanced ERP systems in large enterprises.
The “Bread Factory” Analogy: How to Interpret Results
To make these concepts intuitive, imagine our bread factory:
- Plan: Produce 1,000 loaves (1,000 machine hours).
- Variable Budget: $1 per machine hour.
- Fixed Budget: $1,000,000.
- Actual: Produced only 800 loaves, but used 900 machine hours. Total overhead cost was $2,100,000.
1. The 2-Way Method (Basic)
- Budget Variance: “Even at 900 hours, did we spend more than we should have?” This isolates waste within the factory.
- Volume Variance: “We only made 800 loaves instead of 1,000, so the factory was underutilized.” This is the loss incurred by “idling” the factory.
2. The 3-Way Method (Intermediate)
- Spending Variance: “Was there a pure price increase, like electricity rates rising?”
- Efficiency Variance (Key): “Why did it take 900 hours to make 800 loaves? The extra 100 hours of electricity usage is the production team’s responsibility.”
- Volume Variance: Same as the 2-way method; loss due to low order volume.
3. The 4-Way Method (Advanced)
This method keeps variable costs (electricity) and fixed costs (rent) in completely separate “rooms,” allowing for granular control over efficiency and budget compliance.
Conclusion: Key Takeaways
- Start Simple: Begin with 2-way analysis to grasp high-level trends before moving to more complex 3-way or 4-way models.
- Identify Responsibility: Always distinguish between factors controllable by the field (efficiency) and market factors (price/spending).
- Take Action: Variance analysis is not just about crunching numbers; it is about finding the specific operational “leak” and fixing the process.
- Context Matters: Choose the analysis method that matches your company’s data maturity and reporting needs—don’t let the complexity of the math distract you from the goal of continuous improvement.
“Variance analysis is your operational compass. It doesn’t just show you that you’ve gone off-course; it shows you exactly which turn you missed.”
* This article was created in collaboration with Google Gemini AI. The author independently created, reviewed, and edited the content to ensure professional quality.