
Even if a company reports soaring net income on its income statement, it cannot survive without the consistent circulation of cash—the actual lifeblood of any business entity. While many executives and managers mistakenly focus on accounting profits, the cash flow statement serves as the true compass for assessing corporate value and driving strategic decisions.
To lead an enterprise effectively, corporate leaders must understand the structural mechanics of the cash flow statement, connect these metrics directly to capital budgeting, and adjust reporting data to make accurate investment choices.
1. The Three Pillars of Cash Flow: Structural Diagnostics for Leaders
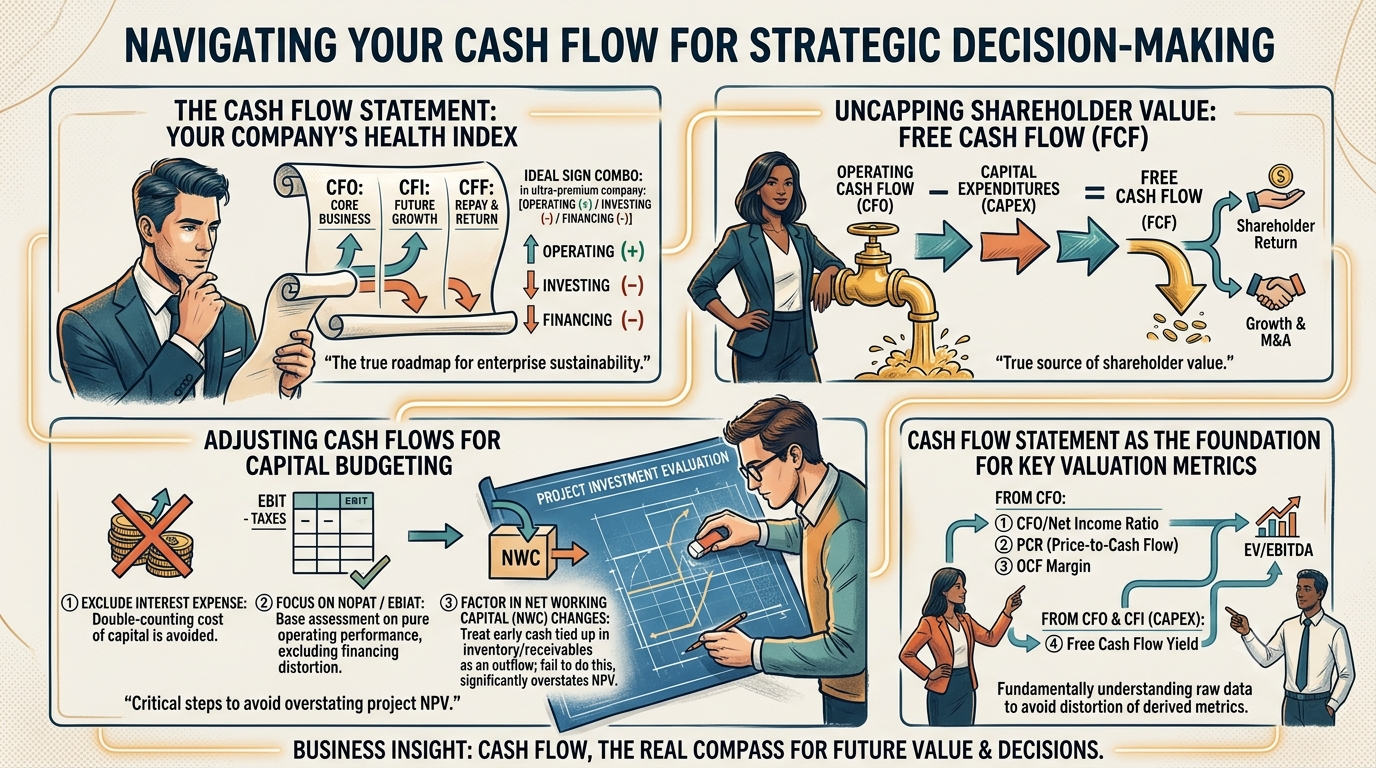
A formal cash flow statement categorizes every dollar moving through an enterprise into three core activities: Operating, Investing, and Financing. Rather than looking at the raw numbers in isolation, executives can instantly diagnose a company’s financial health by analyzing the combination of positive (+) and negative (-) signs across these three pillars.
| Activity Pillar | Core Concepts and Underlying Actions | Strategic and Management Implications |
| Cash Flow from Operating Activities (CFO) | Cash generated or consumed by core business operations, such as selling products, purchasing raw materials, and paying employee salaries. | Core Survival Metric: This proves whether the primary business model is genuinely self-sustaining. A healthy company must maintain a positive (+) sign here to ensure high earnings quality. |
| Cash Flow from Investing Activities (CFI) | Cash spent on or acquired from long-term growth assets, including factory expansions, equipment purchases, equity investments, and intellectual property. | Growth Potential Tracker: Expanding companies actively reinvest in their operations. Therefore, a negative (-) sign is a perfectly normal, healthy signal of future capacity building. |
| Cash Flow from Financing Activities (CFF) | Cash raised from or returned to capital providers, such as securing bank loans, issuing equity shares, repaying debt principal, or distributing dividends. | Capital Structure and Returns: Raising debt or equity generates a positive (+) inflow, while paying down liabilities or rewarding shareholders creates a negative (-) outflow. |
The Premier Corporate Blueprint: The most ideal signature combination for an established, elite enterprise is [ CFO (+) / CFI (-) / CFF (-) ]. This specific pattern reveals a business that generates abundant cash from its core operations, uses that cash to fund future competitive advantages, and channels the remaining surplus to clear debt or reward shareholders.
2. Free Cash Flow: The Definitive Engine of Shareholder Value
While operating cash flow provides an excellent baseline, the ultimate metric for measuring corporate strength is Free Cash Flow (FCF). This metric isolates the actual liquidity left over after the business covers its mandatory operational and structural needs.
$$\text{Free Cash Flow (FCF)} = \text{Cash Flow from Operating Activities (CFO)} – \text{Capital Expenditures (CAPEX)}$$
An organization may report a robust operating cash flow, but if it operates in a capital-intensive industry where massive, non-negotiable investments in machinery or infrastructure are required just to maintain its market position, the actual cash remaining inside the vault will be minimal.
Free Cash Flow represents the unencumbered cash that a business can cleanly distribute to debt holders and equity shareholders. Enterprises that consistently generate expanding Free Cash Flow can fund transformative mergers and acquisitions, spearhead disruptive research, or initiate aggressive share buybacks and dividend growth without relying on expensive external financing.
3. Financial Adjustments for Strategic Capital Budgeting
When evaluating multi-year project proposals or approving major corporate investments through Net Present Value (NPV) or Internal Rate of Return (IRR) models, copying historical numbers directly from accounting statements will lead to major calculation errors. Financial accounting documents the past; capital budgeting predicts the future. To make sound allocation decisions, financial analysts must make three structural adjustments.
A. Eliminating Interest Expenses to Prevent Double-Counting
- The Rational Focus: Capital budgeting models must isolate the raw cash-generating capacity of the asset itself, completely separate from how the company chooses to fund it.
- The Execution Strategy: The financial costs of borrowing are already factored into the discount rate via the Weighted Average Cost of Capital (WACC). Subtracting interest expenses from the project’s projected operational cash flows would double-count the cost of capital, artificially lowering the project’s estimated net present value. Analysts must add back interest expenses to keep the evaluation clean.
B. Reconstructing Flows from Earnings Before Interest After Taxes (EBIAT)
- The Rational Focus: A project’s timeline should never look at standard accounting net income as its starting line, because net income is heavily warped by corporate debt levels and capital structures.
- The Execution Strategy: Financial teams must build their cash flow projections using Earnings Before Interest After Taxes (EBIAT). Once this baseline is established, non-cash book entries that do not involve an actual cash outflow—such as depreciation and amortization—must be added back to build an accurate, project-specific cash timeline.
C. Integrating Net Working Capital Fluctuations
- The Rational Focus: Launching a corporate venture requires an immediate commitment of operational cash to secure raw materials, maintain inventory, and manage accounts receivable. Even though these transactions appear as revenue on an income statement, that cash is physically locked up and unavailable for corporate use.
- The Execution Strategy: Capital budgeting models must treat initial increases in Net Working Capital as a direct cash outflow (-) at the beginning of the timeline. Conversely, when the project wraps up and winds down, the model must show this locked capital being liquidated and recovered as a positive (+) cash inflow.
4. Analytical Frameworks: Connecting Cash Flows to Corporate Valuation
Valuation metrics are not standalone figures; they are specialized analytical lenses designed to evaluate the raw financial data found within a company’s cash flow statement.
A. Core Operating Inflow Metrics
- CFO-to-Net-Income Ratio: This metric compares operating cash flow directly against reported net income to identify disconnects between paper profits and real cash collections.
- Price-to-Cash-Flow (PCR) Ratio: By dividing total operating cash flow by outstanding shares, analysts calculate Cash Flow Per Share (CFPS). Comparing current stock price to CFPS yields the PCR, a metric less vulnerable to accounting manipulation than the traditional P/E ratio.
- Operating Cash Flow (OCF) Margin: Calculated by dividing operating cash flow by total revenue, this metric reveals the percentage of top-line sales that successfully converts into unencumbered cash.
B. Integrated Structural Metrics
- Free Cash Flow (FCF) Yield: This metric evaluates a company’s financial efficiency by comparing its Free Cash Flow directly against its total market capitalization. A high FCF yield indicates that a company is producing a large amount of surplus cash relative to its current market valuation, giving it plenty of capital to fund expansion or reward investors.
C. Pre-Tax Fundamental Metrics
- EV/EBITDA: Enterprise Value to Earnings Before Interest, Taxes, Depreciation, and Amortization serves as a core tool for cross-border corporate comparisons. While operating cash flow records performance after taxes and interest payments, EBITDA backs out these geographic and structural variables. Analysts calculate it by taking operating income (EBIT) from the income statement and adding back depreciation and amortization data pulled directly from the operating cash flow adjustments.
Conclusion: Key Takeaways
- Look Beyond Accounting Profits: Never evaluate corporate health solely on net income; always verify the quality of those earnings by ensuring the company maintains a positive, sustainable Operating Cash Flow (CFO).
- Treat Free Cash Flow as the Gold Standard: Prioritize Free Cash Flow (FCF) over net income when evaluating long-term corporate value, as FCF isolates the real cash available for shareholder rewards and strategic growth.
- Normalize Cash Timelines for Capital Budgeting: When running investment models like NPV, always adjust your data by removing interest expenses, using EBIAT as your baseline, and accounting for Net Working Capital changes.
- Use Valuation Metrics as Strategic Lenses: Remember that metrics like PCR, FCF Yield, and EV/EBITDA are simply tools to analyze a company’s underlying cash statement. You must understand the baseline numbers to accurately interpret the ratios.
* This article was created in collaboration with Google Gemini AI. The author independently created, reviewed, and edited the content to ensure professional quality.