
In modern corporate governance, running a highly adaptable organization while instilling decentralized accountability across business units requires a precise diagnostic infrastructure. To accurately pinpoint and control shop-floor inefficiencies, corporate leaders look to the combination of Lean Manufacturing and Activity Analysis. This integrated framework serves as one of the most powerful modern toolkits for eliminating systemic waste, optimizing operational flow, and turning hidden operational drains into measurable bottom-line profitability.
1. Understanding the Core Concept: A Familiar Analogy
To understand how Activity Analysis and Lean Manufacturing work together, consider how two different managers might run a busy commercial coffee shop.
- The Traditional Approach (Management by Intuition): The manager looks at the espresso bar, sees the barista moving at lightning speed, and assumes operations are running perfectly. What the manager fails to notice is the hidden, non-value-added time: the barista must walk to a back storage room every time they need ice, or spend twenty seconds rummaging through unorganized shelves for a specific cup size.
- The Lean Approach (Activity Analysis & Process Optimization): The manager breaks down the barista’s physical movements second by second. By redesigning the workspace, the ice dispenser and cup racks are placed immediately next to the espresso machine. This physical reconfiguration eliminates unnecessary steps entirely. By removing the physical friction, the manager ensures that nearly 100% of the barista’s time is dedicated to the exact activity the customer pays for: brewing premium coffee.
2. Activity Analysis: Classifying Enterprise Value
Activity Analysis is the systematic process of breaking down an organization’s entire operational workflow into distinct, measurable units called Activities. This deep operational transparency allows management to see exactly where corporate resources are being deployed and whether they are generating a true return.
Through this diagnostic lens, every single action performed on the shop floor or in the office falls into one of two strategic buckets:
- Value-Added Activities (VA): Operations that directly increase the worth of a product or service from the customer’s perspective—actions the customer is explicitly willing to pay for (e.g., machining raw steel, assembling components, or writing production software code).
- Non-Value-Added Activities (NVA): Tasks that consume corporate time, labor, and capital but add zero intrinsic worth to the final deliverable. Customers do not want to subsidize these inefficiencies (e.g., waiting for materials, unnecessary material transport, reworking defective parts, or redundant inspections).
In production ecosystems, these non-value-added actions are collectively referred to as Muda—the Japanese term for waste. Originating from the Toyota Production System, Muda defines any consumption of corporate resources, time, labor, or square footage that fails to advance the product closer to what the customer wants.
The 7 Deadly Wastes of Lean Operations
To systematically root out Muda, the Lean paradigm classifies waste into seven distinct operational categories:
- Overproduction: Manufacturing items before they are ordered or in quantities greater than current market demand. This is widely considered the worst operational sin because it creates and multiplies all other forms of waste.
- Waiting: Idle time where operators or multi-million-dollar machinery stand still, waiting for the previous process step to finish or for materials to arrive.
- Transportation: Shuttling raw materials, work-in-progress inventory, or finished goods between warehouses or separate areas of a facility without altering the product’s form or function.
- Overprocessing: Putting more work, tighter tolerances, or higher finishes on a product than what the customer requested or is willing to pay for.
- Inventory: Allowing excess raw materials, partially finished products, or unsold goods to sit on shelves. Traditional management historically viewed this inventory as a stabilizing asset or buffer. Lean exposes it as an expensive liability that ties up working capital and physically hides systemic process defects.
- Motion: Any physical movement by staff that does not actively add value, such as walking across a factory floor to hunt for tools, bending over due to poor ergonomics, or sorting through unorganized parts.
- Defects: The dual loss of creating a sub-standard product, plus the subsequent time, material, and labor required to either scrap or scrap and rework it.
3. Shop-Floor Strategies for Eliminating Waste
To permanently eliminate these non-value-added activities, operational leaders deploy highly localized process-control and facility layout techniques:
- Product-Focused Layouts and Line Flow: Instead of grouping identical machines together in isolated functional departments, equipment is arranged sequentially based on the exact production flow of a specific product family. This linear alignment cuts down on material transit distances and eliminates waiting loops.
- U-Shaped Cellular Layouts and Cross-Training: Workstations are configured into compact, U-shaped production cells. This layout tightens the operator’s physical loop, minimizing movement. Within these cells, companies cross-train workers to handle multiple consecutive steps. If a bottleneck forms at one station, a cross-trained team member can immediately step in to smooth out the flow.
- Setup Time Reduction (SMED): In high-mix, low-volume markets, changing a machine’s tooling to run a different product variant often causes massive downtime. By applying Single-Minute Exchange of Die methodologies, organizations aim to bring changeover times down to the single digits, keeping equipment online and highly responsive to shifts in demand.
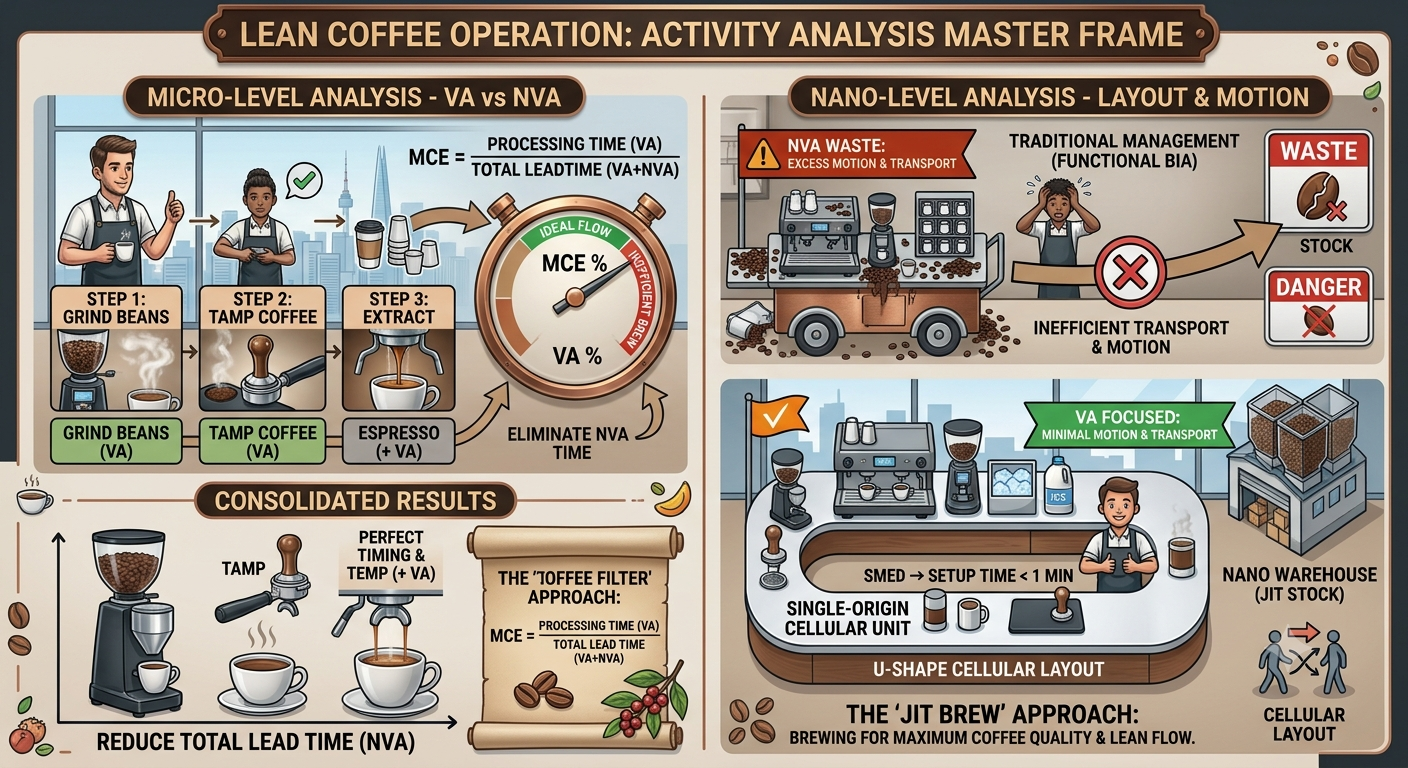
4. Visualizing Value Flow and Quantifying Process Efficiency
To bridge the gap between operational changes and high-level corporate metrics, management teams map out their workflows and track process efficiency using standardized mathematical formulas.
The Activity Analysis Cost Control Framework
Quantifying Success: Manufacturing Cycle Efficiency (MCE)
- Total Throughput Time: The sum of Processing Time (VA) + Inspection Time (NVA) + Move Time (NVA) + Queue Time (NVA).
- Before implementing Lean innovations, traditional mass-production plants typically operate at an MCE of under 10%. In other words, over 90% of the total time a product spends within the facility is non-value-added waste.
- By driving down non-value-added (NVA) time through Lean management, the denominator shrinks, causing the MCE metric to ramp up toward 100%.
Operational improvement must be tied to a rigid metric. This is achieved through Manufacturing Cycle Efficiency (MCE), a key performance indicator that calculates the exact percentage of total lead time spent on actual value creation.
5. Supply Chain Optimization: Merging Logistics with Activity Analysis
Lean manufacturing and activity analysis yield massive financial returns when extended past the factory floor into logistics and Supply Chain Management. Because logistics activities—such as shipping, warehousing, and tracking—do not change the physical form of a product, they are technically non-value-added from a strict consumer viewpoint. Therefore, streamlining this arena is vital to controlling overall lead times.
The Water and the Rocks Analogy
In traditional inventory management, carrying a massive safety stock is treated as a protective asset. Lean management uses the classic nautical analogy of “Water and Rocks” to challenge this view.
Imagine a ship sailing down a river. The water level represents the company’s inventory volume, while the jagged rocks hidden beneath the surface represent deep operational problems: unpredictable supplier delays, poor machinery maintenance, long setup times, and quality defects.
If the manager keeps the water level high by storing massive amounts of excess inventory, the ship glides right over the hazards. Everything looks fine on the surface, but the underlying operational issues are never fixed.
By systematically lowering the water level—meaning intentionally reducing inventory volumes—the ship is forced to confront the rocks. This exposes the root inefficiencies, forcing the operational team to fix the underlying issues rather than hiding them under excess stock.
Pull Logistics and Value Stream Mapping
To keep inventory lean, organizations transition from a speculative “Push” model to a responsive, demand-driven Pull System. Utilizing visual signaling tools like Kanban, components are pulled forward through the supply chain only when an end-user or a downstream workstation consumes an item.
To visualize this entire ecosystem, teams construct a Value Stream Map (VSM). This diagnostic blueprint charts both the physical movement of products and the flow of information from raw material procurement to final delivery, making it easy to identify where cash gets trapped in administrative or logistical bottlenecks.
6. Financial Controls: Activity-Based Management
To track these savings on the balance sheet, corporate accounting systems connect process improvements directly to financial metrics using Activity-Based Costing and Management.
Tracking Financial Impact
Management calculates waste reduction using a financial formula that puts an exact dollar value on operational inefficiencies:
$$\text{Non-Value-Added Cost} = (\text{Actual Activity Quantity} – \text{Optimal Standard Quantity}) \times \text{Cost per Activity Unit}$$
$$\text{Value-Added Ratio (VAR)} = \frac{\text{Value-Added Cost}}{\text{Total Manufacturing Cost}} \times 100$$
The Non-Value-Added Cost serves as a financial alarm for executives, showing exactly how much capital is being lost to issues like part reworks or storage overages. Meanwhile, the Value-Added Ratio (VAR) tracks the percentage of total corporate spend that actively builds product value. Under modern decentralized management, improving this ratio month-over-month is a primary performance target for operational executives.
| Category | Traditional Mass Production (Push System) | Lean Production (Pull System) |
|---|---|---|
| Production Logic | Forecast consumer demand and proactively build inventory, push out massive production volumes beforehand (Push). | Manufacture only required volumes precisely when pulled or explicitly requested by downstream processes (Pull). |
| View on Inventory | ‘An asset and a protective buffer’ (A positive resource that safely blankets process problems). |
‘An operational evil and a heavy cost’ (A systemic obstacle that prevents underlying problems from being exposed). |
| Quality Control | Sorting and filtering out defective products at the final inspection block following mass production. | Real-time troubleshooting and defect resolution directly embedded inside the production line (Real-time Quality). |
| Worker’s Role | Operators specialized exclusively in simple, repetitive workflows inside a single siloed process. | Cross-trained, multi-functional workers granted full authority to halt lines and drive continuous improvement. |
| Target Flexibility | Maximizing economies of scale to drastically cut down fixed manufacturing costs per unit. | High-mix, low-volume production structured to respond dynamically and rapidly to volatile market shifts. |
- Non-Value-Added Cost (NVA Cost): A quantitative financial loss metric derived by multiplying wasted operations (e.g., total defect reworks, unnecessary material holding cycles) by the individual cost unit rate. Executive leadership leverages this dollar figure to prioritize strategic operational interventions.
- Value-Added Ratio (VAR): The percentage of total enterprise cash outflows that directly advances product value from the end-consumer’s perspective, separating pure value creation from cost inflation.
- Under activity-based accountability management, operational headers monitor this ratio on a continuous loop, pushing to maximize the VAR score while steering the total NVA Cost toward a zero-loss baseline every month.
7. Strategic Pitfalls: A Guide for Executive Leadership
When introducing Activity Analysis and Lean principles across an enterprise, CEOs must watch out for three common strategic missteps:
- Using Lean as a Tool for Staff Downsizing: When an activity analysis successfully identifies and cuts out non-value-added tasks, it naturally frees up employee time. If executives use this newly found efficiency as an excuse for corporate layoffs, shop-floor workers will quickly push back. They will hide process data and protect existing inefficiencies out of self-preservation. Leaders should commit to an upskilling model: reallocate freed-up labor toward high-value corporate projects like product development or advanced quality engineering.
- The Danger of Chasing Localized Capacity Utilization: Traditional accounting models push plant managers to keep machinery running constantly to artificially lower fixed costs per unit. Under Lean, running equipment without an active customer order is a major operational error. Executive leadership must shift management bonuses away from simple machine utilization metrics, focusing instead on total process lead-time reductions and MCE scores.
- Managing Supply Chain Vulnerabilities: Cutting safety stock to absolute zero makes an organization highly vulnerable to global supply chain disruptions, such as shipping delays or geopolitical issues. Rather than enforcing a blanket zero-inventory rule, executives should use activity analysis to build targeted, strategic buffers around long-lead-time components and critical materials.
8. Analyzing the Real Cost of Quality (COQ)
Viewing the Cost of Quality (COQ) through an Activity Analysis lens means categorizing every single quality-related action based on its true contribution to the product. This framework divides activities into control actions (investing in doing things right) and failure actions (paying the price for things going wrong).
The Hierarchy of Quality Costs
Deep-Dive Quality Activity Matrix
| Macro Category | Quality Cost Item | Activity Value Class | Core Activities & Operational Examples |
|---|---|---|---|
| Control Activities (Costs of Conformance) | ① Prevention Activities (Prevention) |
Value-Added (VA) |
|
| ② Appraisal Activities (Appraisal) |
Semi- Value-Added |
|
|
| Failure Activities (Costs of Non-Conformance) | ③ Internal Failure (Internal Failure) |
Non- Value-Added (NVA) |
|
| ④ External Failure (External Failure) |
Non- Value-Added (NVA) |
|
From an analytical standpoint, the goal of this matrix is simple: ruthlessly eliminate failure activities, optimize and trim appraisal spending, and invest those savings into prevention activities. Getting a process right the first time is the most effective way to drive down the total cost of quality.
Conclusion: Key Takeaways
1.Map the Baseline Architecture:Phase 1.
Conduct a comprehensive Activity Analysis using Value Stream Mapping to separate value-added tasks from non-value-added waste, setting clear performance benchmarks.
2.Reconfigure Shop-Floor Geometry:Phase 2.
Transition away from isolated functional departments by implementing product-focused layouts and U-shaped production cells to eliminate transit and motion waste.
3.Align Accounting to Operations:Phase 3.
Shift corporate reporting from traditional volume-based metrics to Lean-focused KPIs, using Manufacturing Cycle Efficiency (MCE) and Value-Added Ratios (VAR) to evaluate management performance.
4.Establish Strategic Resiliency:Phase 4.
Protect the business from external shocks by designing calculated, strategic material buffers around long-lead items, rather than blindly slashing all inventory down to zero.
* This article was created in collaboration with Google Gemini AI. The author independently created, reviewed, and edited the content to ensure professional quality.