
In capital management, few operational maneuvers dictate success or failure as dramatically as averaging down—the practice of lowering your average cost basis by purchasing more shares as prices decline. While often used as an emotional coping mechanism to survive drawdowns, effective dollar-cost averaging must be rooted in structural mechanics, risk limits, and financial modeling.
This analytical breakdown contrasts the structural mechanics of the US and South Korean equity markets. It explores why a strategy that creates generational wealth in Wall Street blue chips can completely obliterate capital on the Seoul bourse.
1. Structural Comparison: US vs. South Korean Equity Markets
The fundamental logic behind adding capital to a losing position depends on market structure. In the United States, equity markets are powered by structural drivers: global liquidity inflows, aggressive share buyback programs, and secular corporate earnings growth. Consequently, drawdowns represent temporary market adjustments, making continuous Dollar-Cost Averaging (DCA) and Buy & Hold strategies high-probability winners over long horizons.
Conversely, the South Korean stock market (KOSPI) is structurally cyclical and export-driven. Heavily weighted toward semiconductors, automotive manufacturing, and raw materials, it experiences extreme macro volatility. In South Korea, averaging down should rarely be treated as a long-term accumulation vehicle. Instead, it serves as a tactical, short-term mechanism designed to lower cost basis for an efficient exit during technical rebounds.
| Comparison Items | U.S. Market | Korean Market |
| Structural Market Character | Structural Bull • Shareholder-friendly policies (share buybacks/cancellations, etc.) • Continuous profit generation by blue-chip companies | Cyclical Box / Volatile Range • High dependence on cycles (exports, raw materials, semiconductors, etc.) • High external volatility and geopolitical risks |
| Nature of Declines | ‘Time correction’ and ‘buying opportunities’ driven by economic cycles | ‘Sharp volatility’ and ‘prolonged stagnation’ caused by external headwinds |
| Core Purpose of Averaging Down | Maximize returns (expand long-term performance by buying at lower price bases) | Loss defense and quick break-even exit (capital recovery) |
| Execution Strategy for Averaging Down | Systematic Dollar-Cost Averaging (DCA) during decline phases • Increase position size at set decline thresholds (-10%, -20%) | Precision entry after confirming the bottom • Do not buy a falling knife; deploy capital only after confirming sideways movement or rebound trading volume |
| Suitable Investment Products | • Index ETFs (S&P 500, QQQ): Very high win rate for mechanical averaging down • Monopolistic Megacaps: Upward trajectory over long-term holding | • 1X Index ETFs: Able to defend portfolio even in worst-case scenarios • Individual Stocks / KOSDAQ: Averaging down is extremely limited due to risk of delisting or value destruction |
| Goal After Averaging Down | Breaking previous high and realizing macro trend profits through long-term holding | Selling without hesitation for a break-even or minor profit at the rebound wave (primary technical resistance level) |
2. Large-Cap Performance Dynamics: Top 20 Concentration
Understanding stock concentration reveals why averaging down carries asymmetric risks in different regions. In the US market, Megacap Tech leaders (e.g., Nvidia, Apple, Microsoft, Alphabet, Amazon) act as resilient engines of index expansion. Sustained revenue growth allows these leaders to rebound swiftly following macroeconomic corrections.
In contrast, South Korea’s KOSPI is heavily top-heavy. Samsung Electronics and SK Hynix combined represent 30% to 40% of the entire index’s market cap. Because these companies depend entirely on global memory chip supply cycles, market corrections are often prolonged, exposing investors to multi-year sideways trends or sharp declines.
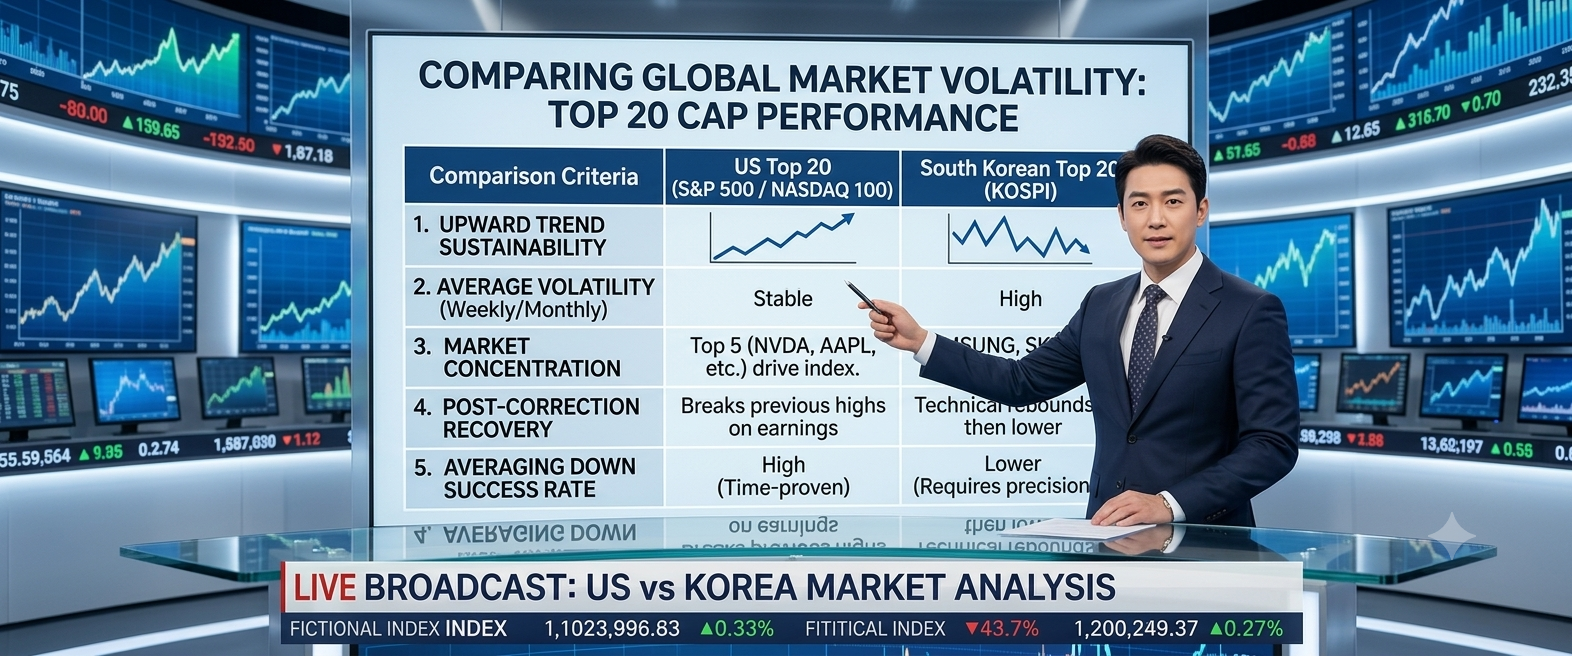
| Comparison Criteria | U.S. Top 20 Market (S&P 500 / Nasdaq 100) | Korean Top 20 Market (KOSPI) |
| Sustainability of Upward Trajectory | [Very High] The long-term upward trend is sustained, with fast recovery speeds during pullbacks. | [Low] High amplitude driven by cycles, leading to prolonged range-bound trading or repeated sharp swings. |
| Average Volatility (Weekly/Monthly) | Relatively Stable (Gradual upward trend led by Big Tech + backed by earnings fundamental) | Extreme Volatility (Heavy concentration on short-term themes such as semiconductors, secondary batteries, biotech, etc.) |
| Impact of Market Cap Concentration | The Top 5 (Nvidia, Apple, Alphabet, MS, Amazon) drive the overall index performance. | Two stocks, Samsung Electronics and SK Hynix, dictate approximately 30–40% of KOSPI index performance. |
| Recovery Pattern After Declines | Breaks previous all-time highs driven by earnings growth (High win rate for averaging down) | Technical rebound followed by secondary decline (Trapped if failing to exit during sector rotation) |
3. KOSPI vs. KOSDAQ: Differing Risk Profiles
A common error among retail market participants is treating the KOSPI (large-cap index) and the KOSDAQ (growth/small-cap index) interchangeably when employing averaging-down tactics.
- KOSPI: Primarily comprised of established industrial blue chips and institutional holdings. Downside risk during cyclical drawdowns can be mitigated through disciplined, 1X index ETF dollar-cost averaging.
- KOSDAQ: Composed heavily of speculative bio-tech startups, retail-heavy momentum stocks, and emerging tech suppliers. Herd behavior drives price action. Averaging down on individual KOSDAQ equities carries significant structural risk, as fundamental degradation, severe dilution, or capital impairment can turn temporary losses permanent.
| Category | KOSPI | KOSDAQ |
| Market Characteristics | Mainly large-cap blue chips (Samsung Electronics, SK Hynix, etc.), driven by institutional and foreign capital flows. | Composed mostly of small-to-mid caps, ventures, and pharma/biotech, exhibiting extreme volatility. Retail investors account for an overwhelming share. |
| Investor Sentiment | Responds relatively transparently to macroeconomic factors and earnings fundamentals. | Strong dynamic of investor sentiment bias (herd behavior), resulting in high speculative volatility. |
| Averaging Down Strategy | Staggered dollar-cost averaging into blue chips and 1X ETFs is effective when entering a downcycle. | Averaging down on individual stocks should be strictly avoided due to severe risks of delisting or permanent value destruction. |
4. Cyclical Market Simulation: The 6,300 → 12,000 → 4,000 KOSPI Wave
To evaluate how product design affects portfolio survival in cyclical environments, let us analyze a simulated market wave for the KOSPI over a multi-month period:
[Month 0: Entry at 6,300] ──► [Month 6: Bull Peak at 12,000] ──► [Month 9: Retrenchment to 7,000] ──► [Month 12: Secular Low at 4,000]
| Comparison Criteria | ① Individual Equities (Blue Chips) | ② 1X Long ETF | ③ -1X Inverse ETF | ④ 2X Leveraged ETF |
| Recommended Entry Zone | Month 9 (7,000 Level) Oversold Dip | Month 9 (7,000 Level) Systematic DCA | Month 6 (12,000 Level) Peak Valuation Target | STRICTLY FORBIDDEN (Mandatory total exit at Month 6) |
| Month 6 Outcome (12,000 Level) | Profit Target Opportunity (+90%) | Stable High Gain (+90%) | Maximum Loss (Critical Risk) | Massive Surplus (+180%+) |
| Month 9 Impact (7,000 Level) | Successfully Lowered Average Cost Basis | Cost Basis Defense (~6,500 Level) | Inapplicable / Neutral | Compounded Downside Risk from -80% Loss Rate |
| Month 12 Final Outcome (4,000 Level) | Severe Capital Deficit (-40%+) | Managed Drawdown Defense (-25%) | Profitable Exit Turnaround (+30%+) | Complete Capital Destruction (-90%+) |
| Core Execution Rule | Mandatory profit taking at 12,000 peak | Ideal vehicle for defensive, long-term portfolio preservation | Success depends entirely on timing the 12,000 peak entry | Absolute 100% liquidation required at 12,000 peak |
Outcome Analysis Across 4 Investment Instruments
- Individual Blue-Chip Equities:
- Execution Point: The investor averages down at Month 9 when the index corrects to 7,000 (a -41% decline from its 12,000 peak).
- Final Result (at 4,000 Points): Severe Loss (-40%+). Failing to lock in gains at the 12,000 peak and deploying capital during a cyclical breakdown compounds losses as the stock declines further to 4,000.
- 1X Long Index ETF:
- Execution Point: Mechanical DCA executed at the 7,000 consolidation level.
- Final Result (at 4,000 Points): Capital Preservation (-20% to -30%). Because 1X ETFs track index fundamentals without leverage-induced decay, averaging down lowers the cost basis toward mid-6,000 levels, positioning the account for a full recovery during the next cyclical expansion.
- -1X Inverse ETF:
- Execution Point: Tactical entry added at the Month 6 peak (12,000 points) as macro indicators overheat.
- Final Result (at 4,000 Points): Outsized Profit (+30%+). While unrealized losses accumulated during the rally from 6,300 to 12,000, adding to the position at macro peak valuations allows the portfolio to capture the full downside movement down to 4,000.
- 2X Leveraged Long ETF:
- Execution Point: Averaging down at Month 9 (7,000 level) on expectations of a rebound back to 12,000.
- Final Result (at 4,000 Points): Total Capital Destruction (-90%+). Volatility drag (decay from daily compounding) continuously erodes principal during multi-month downtrends. Averaging down into a leveraged asset during a structural decline severely impairs capital.
Conclusion: Key Takeaways
- Exit Execution Dictates Success in Cyclical Markets: In cyclical equity markets like South Korea’s KOSPI, long-term capital survival depends heavily on having a disciplined exit strategy during relief rallies rather than relying on endless accumulation.
- Never Average Down on Daily Leveraged Products: Daily reset mechanics create exponential risk through volatility decay during trending drawdowns. Daily leveraged ETFs are tactical short-term trading instruments, not buy-and-hold allocation vehicles.
- Restrict Dollar-Cost Averaging to Unleveraged Broad Indexes: If you choose to deploy capital into falling markets, restrict the execution to 1X unleveraged index vehicles. This limits credit, fundamental, and structural decay risks, preserving capital for the next market cycle.
※ This post is provided strictly for informational purposes and does not constitute a recommendation or solicitation to buy or sell any specific financial instruments or securities. The analysis and opinions expressed herein are based on information available at the time of writing, but no guarantee is made regarding their accuracy, completeness, or timeliness. All investment decisions and risk exposures are solely the responsibility of the individual investor.
※ Some images and technical descriptions in this post were created in collaboration with Google Gemini AI, and were finalized after direct creation, review, revision, and editing by the author.