
In our previous post, we covered the fundamental philosophy of “averaging down” (buying more shares as the price falls) and the strict conditions under which it should be executed. Now, we move from theory to tactics, addressing the critical questions: ‘When exactly should I buy, and how much capital should I deploy?’
Averaging down without a plan is a surefire way to bleed your account dry. However, a mathematically calculated, disciplined approach can transform a portfolio crisis into a major opportunity.
Here is a guide to setting effective buy zones and capital allocation formulas that you can apply immediately to your active trading or long-term investing.
1. Setting Buy Zones: “How Far Must It Fall?”
The most common mistake in averaging down is being too impatient. Investors often buy more shares when the price drops a mere 2% or 3%. In highly volatile markets, this happens constantly. Buying too early results in barely lowering your average cost while rapidly exhausting your cash reserves.
To achieve a meaningful reduction in your cost basis, you must ensure a sufficient price gap between buys.
Guidelines by Asset Type (US Market Examples)
- Mega-Cap Blue Chips (e.g., Apple, Microsoft, Johnson & Johnson): Consider your first additional buy only after a -10% to -15% correction from your previous entry. These stocks are relatively stable, so double-digit drops often represent value.
- Broad Index ETFs (e.g., SPY, VOO – S&P 500 trackers): Look for gaps of -5% to -10%. Because these hold hundreds of companies, their volatility is lower than individual stocks, making smaller percentage drops statistically significant.
- High-Growth / Tech Stocks (e.g., Tesla, Nvidia, or ARKK components): Patience is required here. Wait for a -20% to -30% drop. Buying growth stocks on 5-10% dips is dangerous, as they can easily correct 50% or more during market rotations.
Utilize Technical Support Levels
Do not rely solely on arbitrary percentages. Your probability of success increases significantly if you align your target percentage drops with key technical support levels on the chart, such as:
- Strong prior lows (double bottoms).
- Major moving averages (e.g., the 200-day moving average).
- Significant high-volume “volume shelves” (price levels where a lot of trading occurred previously).
2. The Magic of Allocation: The 1:1:2 “Balanced Pyramid” Rule
The most robust technique for managing capital when averaging down is the Pyramiding structure. Instead of investing equal amounts, this strategy involves increasing your investment amount as the price falls.
Mathematically, this forces your weighted average cost closer to the current, lower market price.
Allocation Strategy Comparison
| Strategy | 1st Buy (Entry) | 2nd Buy (Correction) | 3rd Buy (Crash) | Characteristics |
|---|---|---|---|---|
| Equal Split (1:1:1) | $1k | $1k | $1k | Poor effect on lowering cost basis by the 3rd buy. Easy to manage but hard to recover. |
| Balanced Pyramid (1:1:2) | $1k | $1k | $2k | [RECOMMENDED] The best balance of psychological comfort and mathematical effectiveness for retail investors. |
| Aggressive (1:2:4) | $1k | $2k | $4k | Dramatically lowers cost basis, but requires massive cash reserves. Catastrophic if the thesis fails (Martingale approach). |
3. Real-World Simulation (Applying the 1:1:2 Strategy)
Let’s assume you have $4,000 in total available capital allocated for a specific stock position. You buy a Tier-1 US blue chip at an initial price of $100. Your designated gap for averaging down is set at -15%.
1st Buy (Initial Entry):
- Stock Price: $100
- Capital Deployed: $1,000 (Ratio 1)
- Current Cost Basis: $100.00
2nd Buy (First Correction):
- Scenario: Negative earnings guidance pushes stock down.
- Stock Price: $85 (-15% from entry)
- Capital Deployed: $1,000 (Ratio 1)
- New Cost Basis: $2,000 total invested. New Basis: $92.50
- Insight: The stock only needs to rebound +8.8% from $85 to break even, despite being -15% from your start.
3rd Buy (Market Crash – The Final Stand):
- Scenario: A systemic market panic hits the entire S&P 500.
- Stock Price: $72.25 (-15% from 2nd buy; approx. -28% from initial entry)
- Capital Deployed: $2,000 (Ratio 2)
- Final Result: $4,000 total invested. Final Weighted Cost Basis: Approx. $82.30
The Core Insight
The stock crash from $100 to $72.25 represented a -27.75% crash.
However, by utilizing the 1:1:2 allocation, your average cost basis is now $82.30. The stock does not need to return to $100 for you to recover. It only needs a technical rebound of about 14% from the $72.25 low to make your entire position break even.
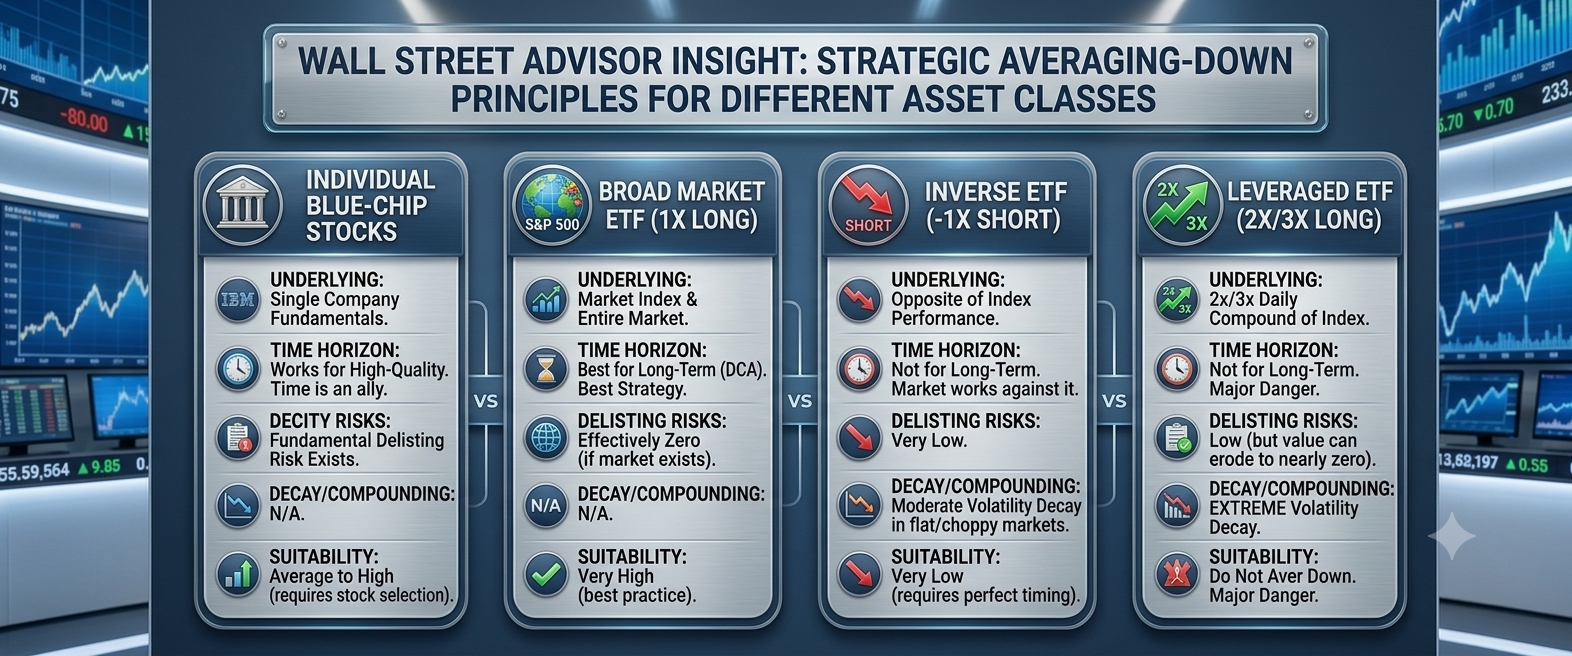
4. Strategy by Vehicle Type: Individual Stocks vs. ETFs
Averaging down results differ vastly depending on the mathematical structure of what you are buying.
| Category | Individual Blue Chips | Long-Only ETFs (1X) | Inverse ETFs (-1X) | Leveraged ETFs (2X/3X) |
|---|---|---|---|---|
| Underlying | Company Fundamentals | Market Index | Opposite of Index | 2X/3X Daily Index Return |
| Bankruptcy Risk | Possible | Practically Zero | Practically Zero | Effectively Zero (but value erodes) |
| Time Effect | Time is an ally for healthy companies | Time is your greatest ally (long-term up bias) | Time is your enemy | Time is your worst enemy |
| Volatility Decay | N/A | Low | High in range-bound markets | Extreme |
| Averaging Down Suitability | Moderate to High (Requires strict screening) | Very High (Best strategy) | Very Low (Short-term only) | ABSOLUTELY NO (Extreme Risk) |
1) Long-Only ETFs (e.g., IVV, VTI): “The Ultimate Victory Strategy”
Mechanically, broad 1X index ETFs cannot go to zero unless the entire US economy ceases to exist. Because the long-term trend of the US market is upward, a disciplined, pre-planned 1:1:2 strategy during corrections ensures that you lower your cost basis during the lows, leading to massive compounding returns during the inevitable recovery.
2) Individual Blue Chips: “Fundamental Recovery” Bet
This works only if the company’s long-term business fundamentals remain sound. If the price drop is due to temporary market panic or a short-term hurdle, averaging down is effective. However, if the company is facing structural decline, you are just throwing good money after bad. Limit this to top-tier, cash-rich market leaders.
3) Inverse ETFs: “Fighting Time and Gravity”
These provide returns when the index falls. Markets historically rise over the long term, meaning inverse ETFs are mathematically designed to lose value over time. Furthermore, if the market moves sideways, “volatility decay” (negative compounding) erodes the ETF’s value. Averaging down on a long-term inverse position is usually a losing battle. It should only be used for ultra-short-term hedging.
4) Leveraged ETFs (e.g., TQQQ, UPRO): “The Mathematical Math Suicide”
- This is the most dangerous application of averaging down. While the 3X returns look appealing on the upside, the path down is mathematically devastating due to volatility decay and negative compounding.
- If an index falls 40%, a 3X leveraged ETF collapses by roughly 120% (effectively wiping out the capital). Once your principal is decimated by 80-90%, averaging down requires multiples of your original investment just to marginally lower the average cost. Leveraged ETFs are short-term tactical tools, not vehicles for long-term averaging down.
5. Summary of Execution Rules
- Plan for Max 3 Buys: Never plan for infinite buys. If the position has fallen through your 3rd planned buy level, stop investing. You must either accept the loss or close the MTS/HTS and simply wait for a market cycle shift.
- Incorporate Time (Period Adjustment): Just because a stock hits your -15% target does not mean you must buy instantly. If the downward momentum is severe, it is safer to wait a few days or weeks for the price to stabilize and trade sideways before deploying the next tranche of capital.