
Formulating a long-term corporate vision and high-level business strategy is only half the battle. The true differentiator between thriving enterprises and stagnant organizations is the structural capacity to translate abstract strategy into frontline execution. The Balanced Scorecard (BSC) serves as an industry-standard performance management framework designed to solve this exact execution gap. By looking at an organization through four interconnected lenses—Financial, Customer, Internal Business Processes, and Learning and Growth—the BSC provides executives with a multidimensional view of operational health.
However, successfully embedding a BSC within an enterprise requires much more than just picking a handful of metrics. It demands an intentional architectural design, deep cross-functional alignment, and a sophisticated approach to organizational psychology. This operational guide establishes the definitive semantic hierarchy of core BSC terminologies, outlines a step-by-step implementation blueprint, maps out multi-level organizational responsibilities, and analyzes the psychological hurdles and systemic pitfalls leaders must neutralize to establish true strategic accountability.
1. Defining the BSC Lexicon and Core Architectural Hierarchy
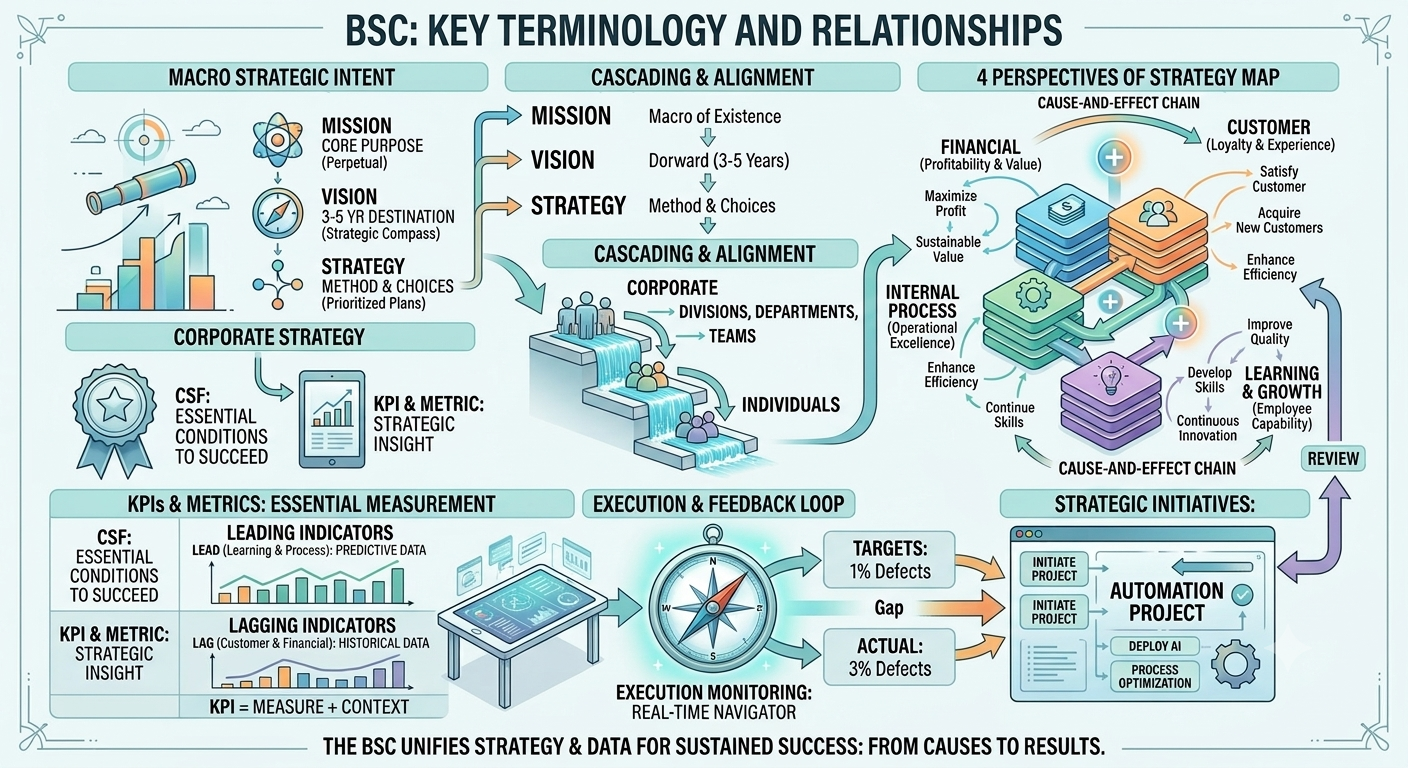
Building an effective BSC framework requires absolute semantic clarity across the entire corporate structure. Performance metrics fail when a leadership team uses words like “Strategy,” “Objective,” and “KPI” interchangeably. In reality, these core terms exist within a strict, logical hierarchy that flows from abstract corporate philosophy down to granular, daily operational data points.
Mission
The ultimate purpose and fundamental reason for an organization’s existence. It answers the primal question: “Why do we exist?” A well-crafted mission statement acts as the permanent north star of an enterprise. It remains constant and unyielding, even when macro market conditions shift or product lines evolve over decades.
Vision
A concrete, ambitious portrait of what the organization aspires to become or achieve within a specific, mid-term planning horizon—typically three to five years. It answers the question: “Where are we going?” Unlike the evergreen nature of a mission, a vision has a target timeline and is designed to energize and rally employees toward a shared future destination.
Strategy
The overarching competitive methodology that outlines exactly how an enterprise will achieve its long-term vision. Strategy is fundamentally an exercise in trade-offs: deciding what to choose, and more importantly, what to sacrifice. It represents a high-level roadmap detailing how a firm will deploy its limited financial, human, and technological resources to build a sustainable competitive advantage in the marketplace.
Cascading
The structural process of systematically decomposing and downwardly deploying high-level corporate strategies into the lower levels of the organizational architecture. Through proper cascading, corporate goals flow seamlessly into divisional strategies, which then split into departmental objectives, team initiatives, and eventually, individualized personal performance scorecards. This creates horizontal and vertical alignment, ensuring every employee’s daily actions directly feed into the firm’s grand design.
Strategic Objectives
The specific, action-oriented milestones an enterprise must hit within each of the four BSC perspectives—Financial, Customer, Internal Processes, and Learning and Growth—to successfully execute its broader strategy. On a corporate strategy map, these objectives serve as the foundational, interconnected nodes that illustrate how the organization intends to generate sustainable value.
Critical Success Factors (CSF)
The vital operational conditions, competencies, or focus areas that an organization must absolutely master to achieve its strategic objectives. While an objective defines what victory looks like, a CSF outlines the specific, non-negotiable operational requirements necessary to get there.
Measure (Raw Data)
The most granular, unrefined, and single-dimension data points collected directly from daily field operations. Measures contain no calculations, percentages, ratios, or business context; they are the raw building blocks of performance tracking. Examples include “30 defective units” or “1,000 total manufactured products.”
Metric / Key Performance Indicator (KPI)
A sophisticated measurement tool built by combining or contextualizing raw measures against a specific business benchmark to reveal operational reality. Metrics are typically expressed as percentages, ratios, averages, or historical trends (such as a “3.0% defect rate”). When leadership sifts through these general metrics and isolates the vital few that are absolutely critical to the survival and execution of the corporate strategy, those selected metrics become Key Performance Indicators.
Leading Indicator
A predictive, forward-looking metric that measures the upstream drivers and activities that directly fuel future performance. These indicators act as early-warning signs and primarily populate the Learning and Growth or Internal Process perspectives of the BSC. Because they track activities currently in progress, managers can actively intervene and optimize them in real time. Examples include average training hours per employee or new product development cycle times.
Lagging Indicator
A historical, retrospective metric that measures the final outcomes of past operational actions. Typically found within the Financial and Customer perspectives, lagging indicators show what has already occurred. While they are impossible to alter after the fact, they provide definitive proof of whether a strategy ultimately succeeded or failed. Examples include quarterly net revenue or net promoter scores.
Targets
The explicit, quantifiable, and time-bound values or performance standards assigned to a specific metric or KPI that the organization expects to achieve. Targets establish the boundary line between baseline compliance and true strategic success. For instance, an operational target might be stated as: “Maintain a defect rate below 1.0% for Q4.”
Actual Value
The real-time, empirically validated performance results harvested from operations during periodic tracking intervals. It represents the objective data sheet of current performance, which is continuously cross-referenced against the pre-set target. For instance, a plant’s data sheet might show an Actual Value of a 3.0% defect rate.
Strategic Initiatives
The concrete, heavily resourced projects, action plans, and programs designed and deployed by teams to bridge the performance gap between the current Actual Value and the desired Target. If an enterprise is missing its targets, strategic initiatives represent the tactical muscle deployed to fix the problem. An example would be launching a Manufacturing Automation Upgrading Project to lower an elevated defect rate.
2. The Step-by-Step BSC Implementation Blueprint
Transforming a high-level corporate vision into aligned frontline execution requires a disciplined, sequential approach. Skipping foundational design steps to rush into software deployment is a primary reason performance frameworks collapse. Enterprises must follow a rigorous six-stage implementation lifecycle.
Phase 1: Define Vision and Strategy
The executive leadership team explicitly aligns on the long-term vision and market positioning of the company. This phase defines the financial growth objectives, target customer segments, and core value propositions that will distinguish the firm from its global competitors.
Phase 2: Create Strategy Map
Leadership organizes their strategic objectives into a visual architecture across the four traditional perspectives. Crucially, they draw explicit cause-and-effect vectors between these nodes. This visual layout must clearly demonstrate the organizational hypothesis: how investing in employee skillsets (Learning and Growth) drives efficiency gains (Internal Processes), which subsequently enhances buyer loyalty (Customer), ultimately maximizing net profit margins (Financial).
Phase 3: Cascade and Align
The centralized corporate strategy map is systematically distributed across the organizational chart. Business unit leaders review the enterprise objectives and construct their own localized scorecards. This ensures that every department is pulling in the exact same strategic direction, eliminating operational redundancy and matrix conflicts.
Phase 4: Develop KPIs and Targets
Teams select the precise metrics that will track the health of their strategic objectives. During this step, designers must carefully balance predictive leading indicators with historical lagging indicators. Once the KPIs are selected, leadership sets challenging yet realistic targets based on benchmark data and historic baselines.
Phase 5: Formulate Strategic Initiatives
With objectives, metrics, and targets established, teams identify where current operations fall short. They design specific, bounded tactical projects to close these performance gaps. Capital expenditure and human resource hours are then formally budgeted and allocated to these strategic initiatives.
Phase 6: Continuous Feedback and Review
The organization activates a continuous monitoring infrastructure. Frontline managers log operational measures, which roll up into executive dashboards. Leadership holds regular strategic review meetings to evaluate performance data, check the validity of their strategic assumptions, and dynamically adjust targets or initiatives as market environments shift.
3. Organizational Architecture: Multi-Level Roles and Responsibilities
A Balanced Scorecard cannot be managed solely by a centralized corporate planning department or an external consulting firm. To survive, the BSC must be deeply integrated into the daily routines of every single layer of the corporate hierarchy, with each tier owning unique responsibilities.
| Organizational Level | Core Operational Role | Primary Strategic Responsibilities & Deliverables |
| Executive Level | Strategic Direction & Corporate Governance | Defines macro mission and vision; authorizes capital allocation; approves enterprise-wide strategy maps; maintains strategic accountability. |
| Middle Management | Tactical Cascading & Functional Alignment | Translates corporate goals into departmental scorecards; manages interdepartmental dependencies; eliminates functional silo barriers. |
| Team Leader Level | Operational Execution & Project Tracking | Designs and launches local strategic initiatives; tracks daily and weekly KPI trends; directly supervises frontline goal completion. |
| Staff Level | Execution Excellence & Data Integrity | Executes core operational tasks and assignments; maintains data logging discipline; maintains integrity of primary frontline measures. |
Executive Level
The Chief Executive Officer and senior leadership team own the macro-level governance of the system. Their primary responsibility is to define the strategic direction and set a unified tone at the top. They do not get bogged down in individual departmental metrics; instead, they review corporate-level strategy maps, authorize large-scale capital deployments, and ensure that the performance management system remains a vehicle for long-term growth rather than a punitive human resources mechanism.
Middle Management
Divisional executives and department heads serve as the operational bridge of the enterprise. Their main task is to execute the cascading process. They take abstract corporate goals and translate them into functional, department-specific scorecards. Middle managers are also responsible for managing cross-functional dependencies, ensuring that the metrics of one department do not inadvertently damage or compromise the performance of a neighboring business unit.
Team Leader Level
Frontline managers and team supervisors turn tactical goals into practical action. They identify, scope, and direct the everyday strategic initiatives required to meet targets. Team leaders run the baseline monitoring systems, tracking performance on a weekly or monthly basis, and actively coach individual contributors to optimize their localized metrics.
Staff Level
Individual contributors and frontline employees are the operational foundation of the entire architecture. Their responsibility is twofold: executing the daily tasks tied to strategic initiatives and maintaining absolute data integrity. Because they are closest to the customer and the production line, their disciplined logging of raw measures determines the accuracy of the entire enterprise dashboard.
4. Managing Psychological Friction and Strategic Malfunctions
When an organization introduces a quantitative performance tracking system, it instantly alters the psychological dynamics of the workplace. If a corporate culture overemphasizes punitive metrics, employees instinctively develop defensive behavioral coping mechanisms that can completely distort corporate data.
- Sandbagging: When compensation or job security is tied directly to hitting a number, managers intentionally propose conservative, easily reachable targets during annual planning. This defensive posturing protects the team’s bonuses but strangles corporate innovation, trapping the enterprise in a state of manufactured mediocrity.
- The “What Gets Measured Gets Done” Distortion: If a system over-indexes on easily quantifiable, short-term metrics, employees completely ignore critical, long-horizon objectives that are difficult to measure, such as brand equity, research and development, and workplace psychological safety.
- Tunnel Vision: Employees narrow their operational focus exclusively to their personal KPI checklists, entirely indifferent to the peripheral damage their actions might cause to the broader firm. For example, customer service representatives might intentionally rush through complex customer tickets to keep their “Average Resolution Time” metric low, inadvertently driving up customer churn.
- Status Quo Bias: A natural institutional resistance to transparency. Long-term staff often resist the implementation of a modern BSC framework because they fear the visibility it brings to their legacy processes, or they are exhausted by the learning curve of a new digital tracking platform.
5. Systemic Pitfalls and Enterprise Success Factors
The difference between a BSC that drives exponential corporate growth and one that disintegrates into an administrative burden comes down to system design and governance choices.
Critical Systemic Pitfalls
- Metric Overload: Trying to track everything at once. When an enterprise cams hundreds of pre-existing operational metrics into the four BSC buckets, the scorecard transforms into an unreadable data dump. True strategy requires focus; overloading the system dilutes employee attention and leaves leadership without clear direction.
- Disconnected Strategy Maps: When a strategy map lacks rigorous causal logic, it fails. If an organization selects a series of disjointed metrics without mapping how they influence each other, the dashboard becomes a collection of isolated data silos, rendering cohesive corporate steering impossible.
- The Punitive Weapon Trajectory: Utilizing the BSC primarily as an administrative whip to cut bonuses or enforce discipline. This heavy-handed approach destroys trust, sparks intense political infighting, and encourages widespread data manipulation across departments.
- Framework Rigidity: Treating a scorecard as an unchangeable corporate monument. If market conditions, consumer behaviors, or corporate strategies change, but leadership refuses to update their legacy KPIs, the tracking framework disconnects from reality, causing teams to optimize for outdated business models.
Enterprise Success Factors
- Active Executive Sponsorship: The executive team must lead by example. The CEO must actively use the BSC strategy map to guide real-time board meetings and capital allocation decisions, proving to the organization that the framework is a core engine of the business.
- Balanced Incentives: Enterprises should decouple compensation from basic, one-to-one metric ratios. Instead, bonuses should be determined using a blended evaluation model that balances company-wide performance, qualitative peer reviews, and overall project completion rates.
- Continuous Metric Auditing: Implementing an annual validation loop to review the KPI portfolio. This process helps leadership detect whether specific metrics are driving unintended negative behaviors, allowing the organization to quickly retire or adjust toxic indicators.
Conclusion: Key Takeaways
The long-term value of a Balanced Scorecard does not stem from sophisticated enterprise software or a massive collection of data points. Its true power lies in its ability to foster organizational alignment and healthy communication.
- Protect Strategy from Metric Subversion: A metric is merely an operational proxy for an objective. When hitting a numeric score becomes more important than fulfilling the actual corporate mission, the performance management system is broken.
- Establish a Living Causal Chain: Ensure your data architecture flows seamlessly from raw frontline measures up to meaningful KPIs, explicitly linked across a logical strategy map that clearly demonstrates how growth drives profit.
- Reduce Punitive Vulnerabilities: De-escalate the stakes of individual metrics by utilizing structured calibration committees and holistic reviews, effectively eliminating the incentive for employees to engage in sandbagging or data manipulation.
- Commit to Continuous Evaluation: Maintain an agile, evolving framework by regularly auditing performance indicators to match shifting global macroeconomic realities, keeping the corporate dashboard accurate and relevant.
* This article was created in collaboration with Google Gemini AI. The author independently created, reviewed, and edited the content to ensure professional quality.