
Cost is like a chameleon; it changes its face depending on the perspective. To a baker, a bag of premium flour is a Direct Material Cost used to create a loaf of organic sourdough. To the bakery owner, however, it is a Variable Cost directly tied to driving revenue.
Behind the simple word “Cost” lies a manager’s relentless pursuit of efficiency and a leader’s grand strategy for profit. Understanding the types of costs is akin to increasing the “resolution” of your business intelligence. Just as we distinguish individual trees to understand the forest, let us meet the diverse faces of cost, starting with how resources are categorized within the manufacturing process.
1. When Numbers Become the Language of Management: Classifying Costs
Every number is waiting for a question. The myriad expenditures recorded on a company’s financial statements have no meaning on their own. Whether that money was spent running factory machinery, funding a sales rep’s travel, or investing in R&D for the future determines the entire direction of a leader’s decision.
Classifying costs is not just a process of bookkeeping. It is the act of identifying the “arteries” through which a company’s capital flows and disappears. Let’s look at the techniques of reassembling fragments of expenditure from a strategic perspective.
2. The Three Elements of Manufacturing Cost (The Core of Cost Structure)
1) Direct Material Cost
- Definition: The cost of raw materials that physically become part of the finished product and are directly consumed in the manufacturing process.
- The Core: Raw materials that are physically identifiable in the final product.
- Strategic Meaning: Usually the largest component of product cost and the heart of variable expenses.
- Function: The primary factor determining both product quality and manufacturing unit cost.
- Examples: Semiconductor chips for a smartphone, or high-grade timber for luxury furniture.
2) Direct Labor Cost
- Definition: Wages paid to employees who are directly involved in the physical conversion of raw materials into finished goods.
- The Core: Labor that directly contributes to the production on the factory floor.
- Strategic Meaning: The core engine of production activity and the embodiment of technical value.
- Function: The benchmark for measuring operational efficiency and labor productivity.
- Examples: Wages for workers on an assembly line at a Tesla Gigafactory.
3) Manufacturing Overhead (MOH)
- Definition: All manufacturing costs except for direct materials and direct labor.
- The Core: Costs incurred for production that are difficult to trace to a specific individual unit.
- Strategic Meaning: Essential indirect support costs required to maintain and manage the production environment.
- Function: The basis for allocating complex manufacturing support costs.
- Examples: Electricity for factory robots, repair costs, salaries for plant supervisors, and depreciation of the factory building.
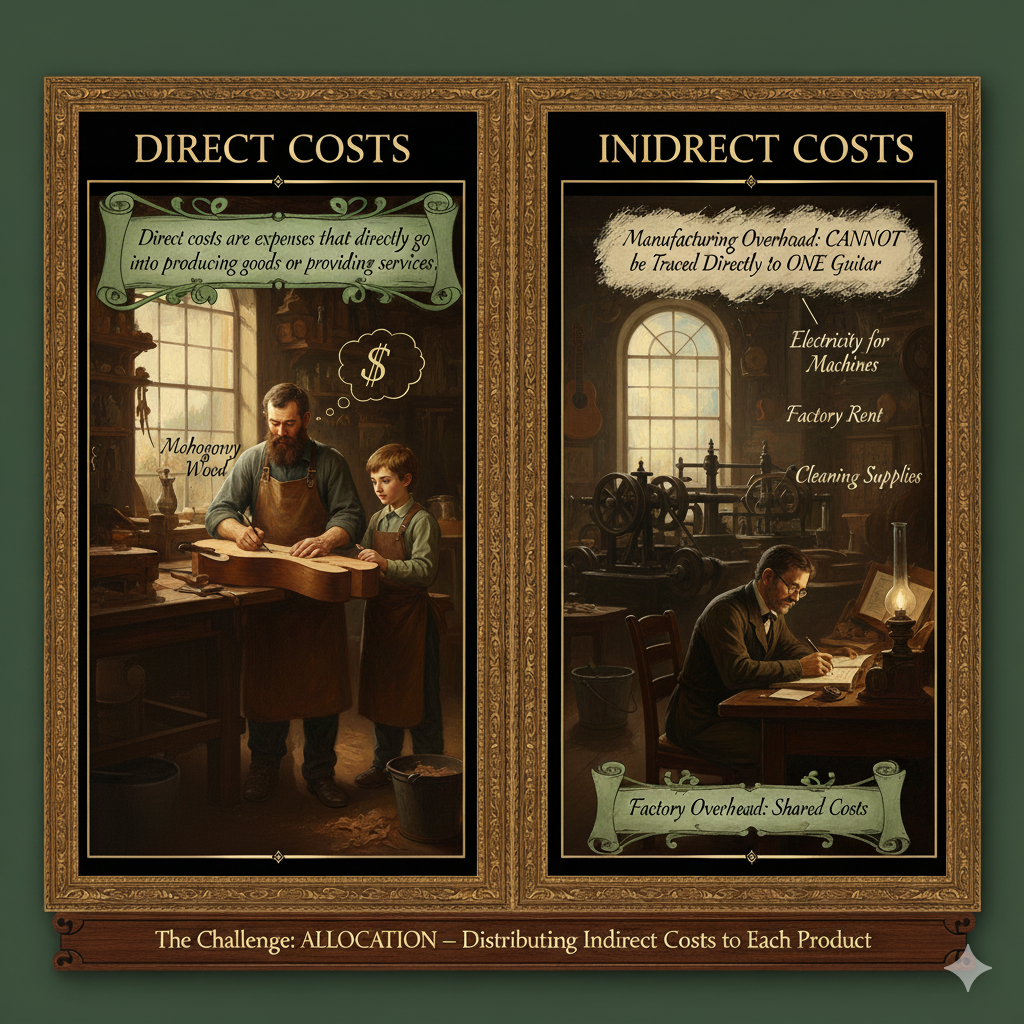
3. Classification by Traceability
1) Direct Cost
- Definition: Expenses that can be directly and easily traced to a specific cost object (such as a product or department). (Direct costs are identified with and can be traced to a cost object.)
- The Core: Resource consumption clearly recognized only for a specific product’s production.
- Strategic Meaning: A clear indicator directly linked to production volume.
- Function: The standard for accurately calculating the profit margin of individual products.
- Examples: The glass screen for an iPhone, or the steel frame of a Ford F-150.
2) Indirect Cost
- Definition: Costs incurred for multiple products or services that are difficult to trace directly to a single unit. (Indirect costs are expenses that cannot be directly linked to a specific product or service.)
- The Core: Common costs that must be divided across various products through an “allocation” process.
- Strategic Meaning: A measure of the overall operational efficiency of the enterprise.
- Function: Distributes the cost of infrastructure that supports production.
- Examples: Factory security, the plant manager’s salary, and specialized equipment maintenance.
4. Classification by Relation to Manufacturing Activity
1) Manufacturing Cost (Product Cost)
- Definition: Costs incurred during the production process that remain as “Inventory” on the books.
- The Core: Recorded as an Asset on the Balance Sheet until the product is sold.
- Strategic Meaning: Value “waiting” to generate future revenue.
- Function: Defers the recognition of the expense until the point of sale.
- Examples: Raw materials, labor, and overhead within a manufacturing plant.
2) Period Cost (Non-manufacturing Cost)
- Definition: Expenses that occur over time regardless of the production volume.
- The Core: Immediately recognized as an expense on the Income Statement in the period they are incurred.
- Strategic Meaning: An indicator of the efficiency of a company’s administration and management.
- Function: Directly determines the net income for the current period.
- Examples: Rent for the corporate headquarters in Chicago, national marketing campaigns, and executive salaries.
5. Classification by Combination of Elements
1) Prime Cost
- Definition: The most fundamental physical elements required for production.
- The Core: The sum of Direct Materials and Direct Labor.
- Strategic Meaning: The most essential resources spent to create a product.
- Function: Forms the core unit cost of production activities.
- Example: The cost of fabric and the tailor’s labor in custom apparel.
2) Conversion Cost
- Definition: The costs incurred to “transform” raw materials into a finished masterpiece. (The costs incurred to convert raw materials into finished goods.)
- The Core: The sum of Direct Labor and Manufacturing Overhead.
- Strategic Meaning: The size of the “Value Added” that a company provides through its technology and effort.
- Function: A tool for analyzing the efficiency of the manufacturing process itself.
- Example: The operational cost of automated robots and the technical labor in a modern assembly line.
6. Connection: Manufacturing Statement to Financial Statements
The core of a manufacturing enterprise is how the costs generated in the factory move through the Balance Sheet and eventually reach the Income Statement.
1) Composition of Manufacturing Costs (COGM)
All costs incurred in the factory are aggregated as the Cost of Goods Manufactured.
- Total Manufacturing Cost = Direct Materials + Direct Labor + Manufacturing Overhead
- Cost of Goods Manufactured (COGM) = Beginning WIP + Total Manufacturing Cost – Ending WIP
2) Cost of Goods Sold (COGS)
Costs are recognized as an “Expense” only at the moment the product is sold.
- COGS = Beginning Finished Goods + COGM – Ending Finished Goods
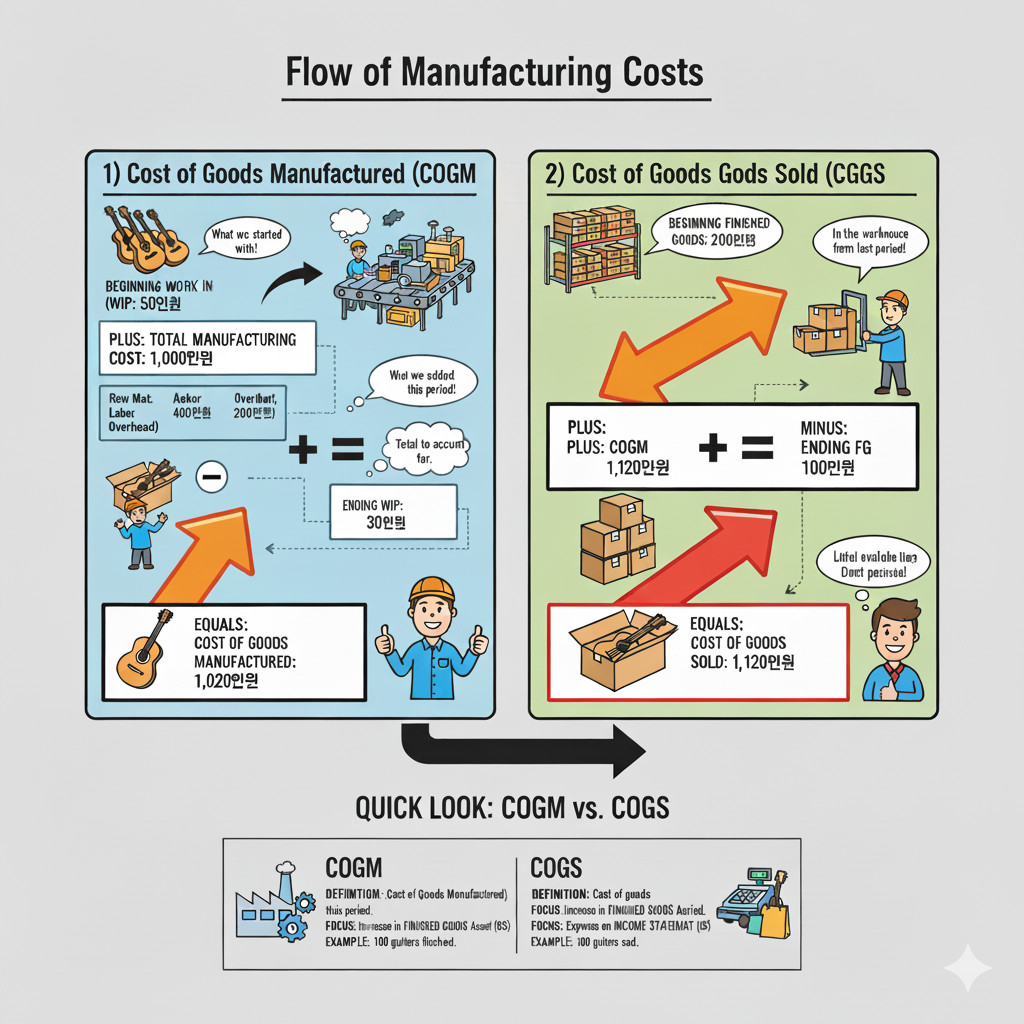
7. The Flow of Manufacturing Costs
1) Cost of Goods Manufactured (COGM)
If there is Work-in-Process (WIP)—meaning items partially completed—the process of finding the COGM can be summarized as: “Adding new costs to what was already on the floor, then subtracting what is still unfinished.”
- Add Beginning WIP: At the start of a new period, we identify the value of “half-finished guitars” left on the workbench from the previous period.
- Add Total Manufacturing Costs: We add all new resources (materials, labor, overhead) poured into the factory this period. This creates the “Potential Total Manufacturing Value.”
- Subtract Ending WIP: At the end of the period, we subtract the value of the items still sitting on the workbench. Only by removing this “unfinished” value can we isolate the cost of the products that were actually completed this period.
2) Cost of Goods Sold (COGS)
This flow is very similar to WIP, but the question changes to: “Of the completed guitars in our warehouse, how much value was actually handed over to customers?”

3) Practical Case Study:
- Initial Data:
- Beginning WIP: $50k (Unfinished goods on the floor)
- Beginning Finished Goods: $200k (Completed goods in the warehouse)
- Ending WIP: $30k (Still unfinished)
- Ending Finished Goods: $100k (Still in the warehouse)
- Total Manufacturing Costs: $1M ($400k Materials + $400k Labor + $200k Overhead)
- The Flow Results:
- Step 1 (COGM): $50k + $1M – $30k = $1.02M
- Step 2 (COGS): $200k + $1.02M – $100k = $1.12M
8. At a Glance: Key Comparisons
| Feature | Cost of Goods Manufactured (COGM) | Cost of Goods Sold (COGS) |
| Definition | Cost of products completed this period | Cost of products sold this period |
| Accounting Shift | Increases “Finished Goods” Asset | Recognized as “Expense” on Income Statement |
| Strategic Meaning | Result of production efficiency | The price paid to generate revenue |
| Primary Function | Determines value of ending inventory | Determines the net income for the period |
Conclusion: Key Takeaways
- Perspective Defines Cost: One dollar spent can be a “Direct Cost” for a product but a “Variable Cost” for a sales strategy.
- The Asset-to-Expense Bridge: Costs are not “lost” money; they are Assets (Inventory) until the customer makes a purchase, at which point they become an Expense (COGS).
- Focus on Conversion: For modern automated factories, Conversion Cost is a more critical metric than Prime Cost for analyzing the true value-add of the technology.
AI Disclosure: Created in collaboration with Google Gemini. All core content was authored, reviewed, and edited by the author.