
In the past, business management was often reduced to a simple mandate: “maximize production and push sales.” Today, modern corporate management is far more sophisticated. It has evolved into a high-stakes intellectual game focused on monitoring how operational expenses are accounted for, particularly regarding how costs can be subtly hidden away inside warehouse inventory.
When market demand drops, a company might aggressively keep its assembly lines running at maximum capacity. Under traditional accounting rules, this boosts paper profits on the income statement, masking weak sales performance. This practice is conceptually identical to someone purchasing an excessive mountain of office supplies, locking them in a supply closet, and falsely claiming, “Since we haven’t used them yet, we haven’t spent any money this month.”
We live in a sophisticated investment era where analysts must look past artificial, packaged earnings to uncover a corporation’s true operational strength. In this article, we will dissect the mechanics of variable costing—the ultimate analytical tool used to neutralize inventory profit distortion—and evaluate how it performs against traditional frameworks across distinct operational scenarios.
1. Understanding Cost Behaviors Through a Simple Analogy
To master the vulnerabilities of traditional accounting and the defensive power of variable costing, it helps to imagine looking at the internal ledger of a local toy factory. The core issue comes down to a structural decision: Should you split the factory’s monthly building rent across every single toy box produced, or should you expense that rent immediately each month, regardless of how many boxes are left stacking up in the warehouse?
1) Core Financial Terms Defined
- Fixed Overhead: These are the structural operational expenses that remain completely unchanged regardless of whether the plant manufactures 1 unit or 10,000 units. Examples include factory rent, facility insurance, and machinery depreciation. It represents the baseline cost of keeping the lights on.
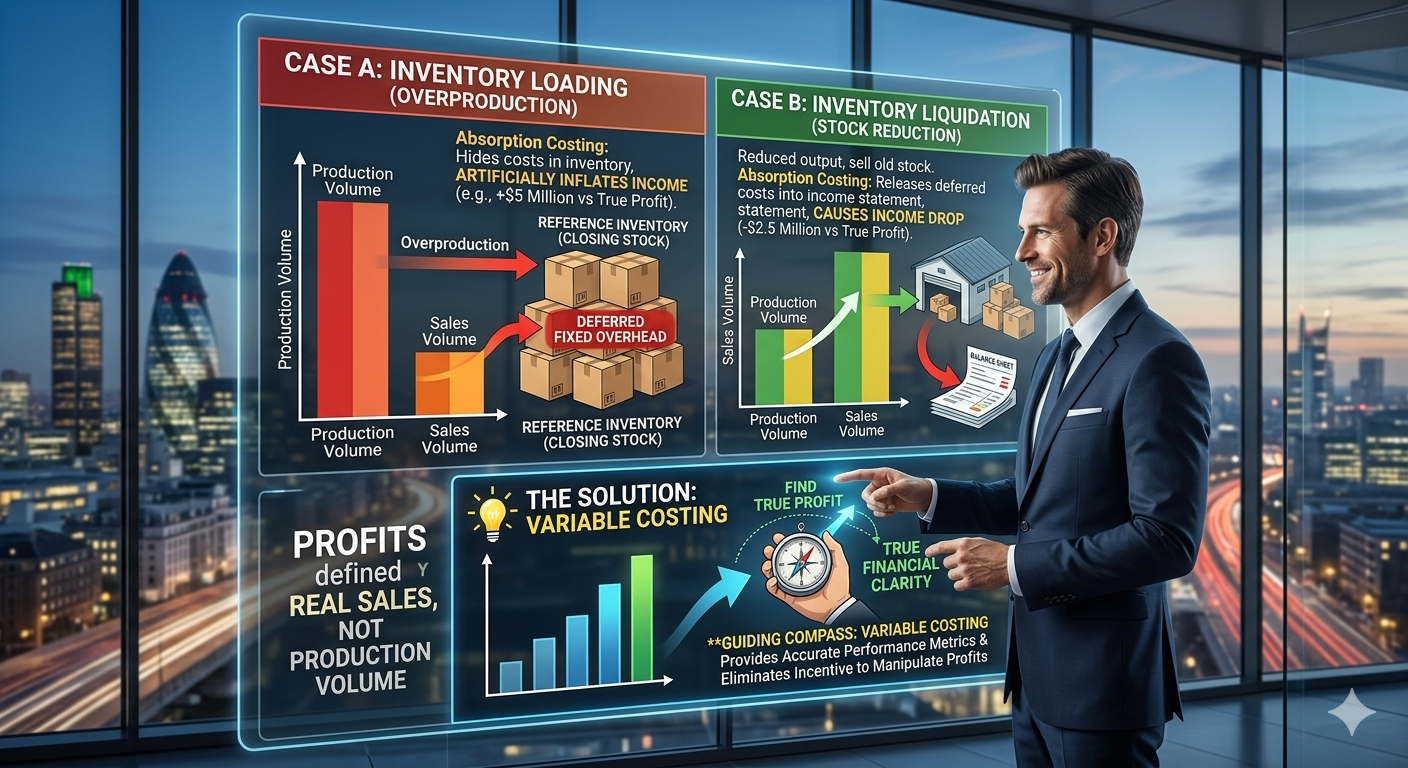
- Inventory Loading: This occurs when management overproduces goods beyond current market demand. The true objective is not immediate sales, but rather packing the warehouse to dilute unit costs. This artificially inflates short-term net income, creating a misleading financial illusion on the corporate scorecard.
- Inventory Liquidation: This takes place when management scales back new production lines and aggressively sells off older inventory accumulated in previous periods. Under traditional accounting methods, this process releases older costs previously trapped in storage directly into the current income statement, often causing reported profits to drop sharply despite strong cash inflows.
2) The Theoretical Core: Inventory as a “Cost Haven”
The divergence between these two systems hinges entirely on how fixed overhead is timed and categorized. Traditional Absorption Costing requires that all manufacturing costs—both variable and fixed—be fully attached to each unit of product. Consequently, massive structural expenses like factory rent are distributed into the physical items.
If those items remain unsold at the end of the quarter, they sit in the warehouse as inventory. Because inventory is classified as an asset on the balance sheet, the fixed overhead embedded within those units is deferred to the next fiscal year. The current period’s income statement is effectively relieved of that expense, allowing current profits to appear artificially high.
Conversely, Variable Costing treats fixed overhead as a “period cost.” It recognizes that structural expenses expire with the passage of time, entirely independent of production volume. Whether inventory piles up or empties out, the total fixed overhead is completely expensed in the month it occurs, closing the loophole where costs can hide inside assets.
The Structural Reality: Absorption costing creates a recurring temptation to overproduce because it allows fixed costs to be deferred inside inventory assets. Variable costing ensures a transparent scorecard by expensing structural overhead immediately.
2. Scenario Analysis: Comparing the Financial Impact
To illustrate these mechanics, consider a manufacturing plant with a fixed variable material cost of $5.00 per unit, a retail selling price of $10.00 per unit, and a flat monthly factory rent (fixed overhead) of $10,000. In both of the following scenarios, the sales team delivers identical real-world results: they sell exactly 1,000 units to customers.
| Calculation Item | Scenario A: Production at 2,000 Units (Inventory Increases by 1,000) |
Scenario B: Production at 500 Units (Inventory Decreases by 500) |
|---|---|---|
| ① Total Revenue | 1,000 units × $10.00 = $10,000 | 1,000 units × $10.00 = $10,000 |
| ② Total Variable Costs | 1,000 units × $5.00 = $5,000 | 1,000 units × $5.00 = $5,000 |
| ③ Fixed Overhead Per Unit | $10,000 ÷ 2,000 units produced = $5.00 | $10,000 ÷ 500 units produced = $20.00 |
| ④ Absorption Cost of Goods Sold (COGS) | 1,000 units sold × ($5.00 Var. + $5.00 Fixed) = $10,000 | (500 current units × $25.00) + (500 older units × $10.00) = $17,500 |
| ⑤ Fixed Overhead Deferred in Inventory | 1,000 unsold units × $5.00 = $5,000 (Moved to balance sheet as an asset) |
None (Instead, $2,500 in older deferred fixed overhead is pulled into COGS) |
| ⑥ Absorption Net Income | $5,000 (Artificially inflated by $5,000 via inventory buildup) |
-$2,500 (Reported loss caused by older costs releasing from inventory) |
| ⑦ Variable Costing Net Income | $0 (Accurately reflects baseline sales performance) |
$0 (Remains consistent, unaffected by inventory drawdowns) |
| Strategic Assessment | Absorption Costing Distortion: Profits are overstated by hiding $5,000 of factory rent in the warehouse. | Variable Costing Clarity: Highlights operational efficiency by keeping profits tied directly to real sales. |
Cost and Profit Calculations Across Scenarios
1) Scenario A: Production Volumetric Surplus (Production > Sales)
In an attempt to maximize short-term bonuses or present a stronger corporate face, management increases factory production to 2,000 units despite soft demand. Since only 1,000 units are sold, the remaining 1,000 units flow directly into warehouse storage.
- Through the Lens of Absorption Costing: Because 2,000 units were produced, the fixed overhead allocated per unit drops down to $5.00. The 1,000 unsold units absorb half of the monthly factory rent ($5,000) and carry it over to the balance sheet as an asset. Because this $5,000 is removed from the current income statement’s expenses, absorption net income climbs to $5,000, masking the flat sales performance.
- Through the Lens of Variable Costing: The entire $10,000 monthly rent is expensed immediately. The inventory buildup is ignored for cost allocation purposes, resulting in a net income of $0. This accurately reflects that the company only broke even on its true marketplace transactions, neutralizing the overproduction tactic.
2) Scenario B: Inventory Drawdown and Liquidation (Production < Sales)
Recognizing the excessive storage build-up, management consciously scales back production down to 500 units for the following period. To fulfill customer demand, the sales team delivers 1,000 units by drawing down 500 units from the existing warehouse reserves.
- Through the Lens of Absorption Costing: Because current production is low, the fixed overhead allocation rate spikes to $20.00 per unit for the 500 units made this month. Furthermore, as the 500 older units are pulled out of storage and sold, the $5.00 per unit of fixed cost previously hidden inside them is finally released into the income statement. This causes total Cost of Goods Sold to swell to $17,500, penalizing the company with an artificial paper loss of -$2,500, even though management made the right strategic choice to clear out the warehouse and improve liquidity.
- Through the Lens of Variable Costing: The system ignores the drawdown of old inventory units and simply charges the current month’s actual $10,000 rent straight to the period. Net income remains steady at $0. This rewards management for maintaining consistent sales performance without punishing them for optimizing inventory levels.
3. High-Leverage Industries to Monitor
This accounting divergence is most evident in capital-intensive industries characterized by high fixed asset bases and significant manufacturing overhead.
- Mass facility depreciation
- High risk of inventory loading
- Distorts absorption profit lines
- Negligible physical inventory
- Immediate expense recognition
- Profit matches market sales
- Heavy Manufacturing & Capital-Intensive Sectors: Companies operating large-scale assembly lines, heavy industrial machinery, or semiconductor fabrication plants carry immense fixed depreciation costs. Under international accounting standards (such as IFRS or US GAAP), these firms are legally required to use absorption costing for their external financial reporting. Consequently, during economic slowdowns, there is an inherent structural incentive to keep factories running to avoid immediate profit drops. Savvy investors must carefully cross-reference operating income growth against corresponding spikes in inventory assets on the balance sheet.
- Service and Digital Content Enterprises: Companies focused on software development, cloud computing, or media production carry minimal physical inventory. Because they do not have large warehouses to store unsold goods, their reported financial metrics naturally track closer to a variable costing model. Their revenue lines and net operating profit lines move in close symmetry with actual sales figures, leaving almost no room for inventory cost adjustments.
4. Analytical Summary Matrix
| Evaluation Category | Absorption Costing Framework | Variable Costing Framework |
|---|---|---|
| Susceptibility to Distortion | High; shifting production volumes can artificially inflate or deflate earnings. | None; net profits are determined solely by market sales volume. |
| Production > Sales Impact | Fixed overhead is deferred into inventory, causing profits to be overstated. | Fixed overhead is fully expensed, showing a transparent result. |
| Production < Sales Impact | Prior deferred fixed overhead is released, causing profits to be understated. | Profit tracks market consumption, unaffected by warehouse drawdowns. |
| Internal Management Value | Can incentivize overproduction and sub-optimal inventory management. | Provides clear, objective operational insight for strategic planning. |
While publicly traded corporations must continue using absorption costing to comply with standardized external reporting regulations, internal executive teams need variable costing to protect against operational blind spots and guide strategic decision-making. Recognizing how these two accounting models treat fixed overhead is what separates casual market observers from sophisticated financial analysts.
Conclusion: Key Takeaways for Corporate Leaders
To accurately assess a company’s operational health, management teams and investors must look past surface-level profit numbers.
- Isolate Sales from Production Surpluses: Always check whether a sudden increase in net operating income is driven by genuine market demand or by an artificial expansion of factory utilization that hides costs in the warehouse.
- Evaluate the Quality of Working Capital: A continuous accumulation of finished goods inventory on the balance sheet is often a warning sign of deferred expenses rather than a valuable accumulation of corporate wealth.
- Implement Variable Costing for Internal Metrics: When designing performance goals and bonus structures for business unit managers, base your internal evaluations on variable costing principles to prevent teams from overproducing just to manipulate short-term earnings.
AI Disclosure: Created in collaboration with Google Gemini. All core financial frameworks, cost accounting principles, and mathematical scenario analyses were authored, thoroughly reviewed, and edited by the author to ensure strict compliance with North American management accounting standards.