
The precision of Job-Order Costing captures every nuanced preference and unique characteristic of a customer, translating them into concrete figures. However, when a CEO’s vision shifts toward the global market and “Economies of Scale,” the entire paradigm of cost accounting must pivot.
On a high-speed production line churning out thousands of energy drinks per minute, tracking the exact electricity cost for a single can is not only impossible—it is managerially irrelevant. While many understand that Job-Order and Process costing are used in different scenarios, the fundamental “why” behind their structural differences often remains elusive. In this post, we will break down the DNA of these two systems through practical examples to show how they fundamentally change the way you see your bottom line.
1. “Process” vs. “Job”: Different Containers for Financial Data
While these terms might sound interchangeable in casual conversation, in the world of cost accounting, they represent entirely different “vessels” for collecting data. The direction in which information flows is the first major point of divergence.
- Job (The “Whose” Factor): Here, the core question is “Whose product is this?” Data is stacked vertically. Every dollar spent is recorded in real-time on a specific “Job Cost Sheet” tied to a unique customer order number.
- Process (The “Where” Factor): The core question is “Which stage is this in?” Data flows horizontally. Instead of tracking individual items, we pour a month’s worth of expenses into massive “departmental buckets.”
2. Case Study 1: The Identity Crisis of a Canned Beverage
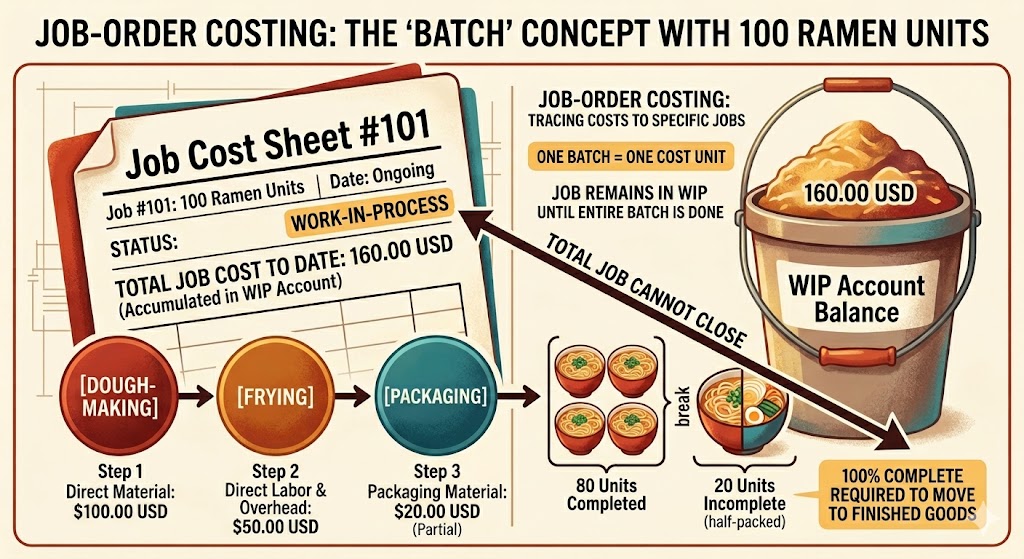
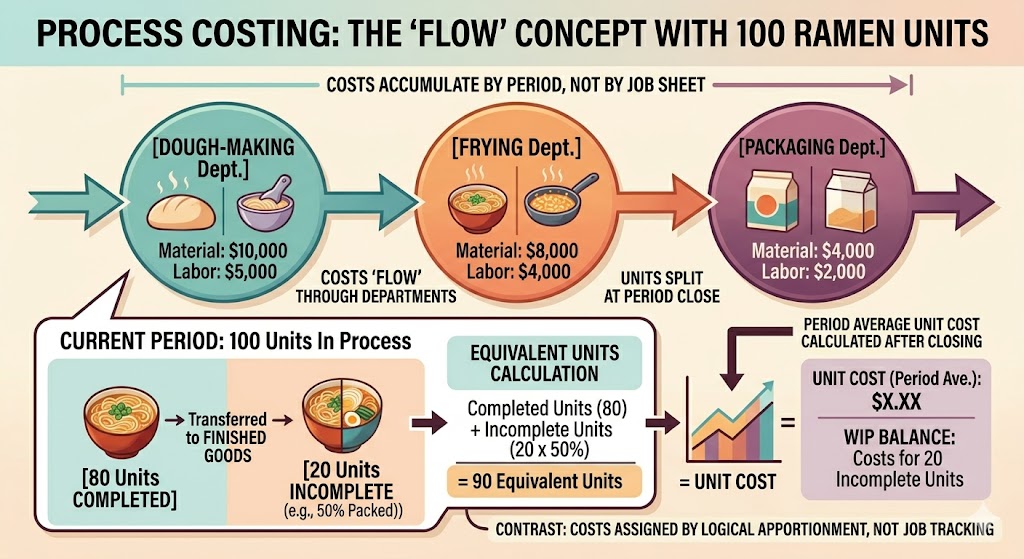
Imagine producing 100 packs of ramen. The production stages are [Dough Mixing] → [Frying] → [Packaging]. Total monthly costs are $170 ($100 for flour, $50 for oil, $20 for packaging). By month-end, 80 packs are finished, while 20 are stuck in the packaging stage (50% complete).
① Job-Order Costing: The Real-Time Dashboard for the Agile Manager In this scenario, the accountant’s desk has only one ledger: Job #101 (100 Cases).
- Cost Accumulation: As the liquid is mixed, $100 is logged. As it’s carbonated, $50 is added. The costs are noted as they happen.
- Year-End/Month-End Settlement: It doesn’t matter if 20 cases are unfinished. You simply look at the bottom of the ledger and see $160 has been spent so far.
- Conclusion: The Work-in-Process (WIP) value is exactly $160. You don’t need complex math; you just “look it up.” The information is alive and immediate.
② Process Costing: The Systematic Post-Mortem Allocation There are no individual ledgers here. Instead, there are three “expense bins” labeled [Mixing], [Carbonating], and [Packaging].
- Cost Accumulation: You only check the total receipts in each bin at the end of the month.
- Year-End/Month-End Settlement: You now face a mathematical puzzle: How much of that $170 belongs to the 20 unfinished cases?
- Conclusion: The WIP value is the result of Allocation. No one knows the exact cost until the final calculation is performed at the end of the period. This “information time lag” is the inherent challenge of process costing.
3. Case Study 2: Comparing the Three-Stage Flow (A → B → C)
Let’s look at a standard three-stage production:
- Stage A: Raw Material Input & Initial Assembly
- Stage B: Precision Machining & Feature Integration
- Stage C: Finishing & Packaging
1) Job-Order Costing in Action
- Context: Used for custom orders (e.g., bespoke furniture, specialized machinery, or luxury yachts).
- Logic: Every time a specific order (#101) moves through a stage, the costs are tagged directly to it.
- Stage A: Materials $1,000 + Labor $500 = $1,500
- Stage B: Custom Parts $300 + Skilled Labor $700 = $1,000
- Stage C: Packaging $100 + Shipping Prep $200 = $300
- Result: The total cost for Job #101 is $2,800.
2) Process Costing in Action
- Context: Used for continuous mass production (e.g., semiconductors, soft drinks, or standardized automotive parts).
- Logic: Total costs per stage are divided by the total output to find a moving average.
- Stage A (Total $15,000): Cost per unit = $15,000 / 1,000 units = $15
- Stage B (Total $10,000): Cost per unit = $10,000 / 1,000 units = $10
- Stage C (Total $5,000): Cost per unit = $5,000 / 1,000 units = $5
- Result: The average cost per unit is $30.
4. Comparison Table: At a Glance
| Feature | Job-Order Costing | Process Costing |
| Primary Goal | Custom Accuracy per Order | Scale Efficiency per Period |
| Cost Object | Specific Job/Customer Order | Production Process/Department |
| Record Keeping | Individual Job Cost Sheets | Departmental Production Reports |
| Product Variety | High (Unique, Custom Products) | Low (Standardized, Mass-Produced) |
| Data Accumulation | Real-time (Vertical) | Periodic (Horizontal) |
| Key Challenge | High Administrative Overhead | Complex WIP Valuation (Equivalent Units) |
| Best For | Construction, Law Firms, Consulting | Food/Beverage, Oil Refining, Chemicals |
5. The Critical Divergence: Why the “80 vs. 20” Split Matters
This is where the conceptual difference between the two methods truly shines.
- In Job-Order Costing: The “All-or-Nothing” Status If Job #101 calls for 100 units and 20 are still on the line, the entire job is often treated as WIP. Because the order was for a “set” or a specific “batch,” the value isn’t fully realized until the customer’s specific requirements are fulfilled. If you wanted to move only 80 units to “Finished Goods,” you would have to manually “carve out” their cost, which isn’t what the system is designed for.
- In Process Costing: The Mathematical Precision of “Equivalent Units” The system doesn’t care about “Job #101.” It only cares about the flow of the conveyor belt. Using the Equivalent Units method, we say: “We have 80 full units plus 20 units that are 50% done. That equals 90 full units of effort this month.” We then divide our total costs by 90 to allocate the value fairly between the warehouse and the assembly line.
6. Why Conventional Textbooks Miss the Mark
Most textbooks focus heavily on the “How” (the complex calculations) but ignore the “Why” (the managerial impact). To a CEO, the difference is about the timing of data.
- Job-Order Costing offers traceability. No matter how many stages you have, you can see exactly where a specific customer’s money is going.
- Process Costing offers systemic efficiency. As the number of stages increases, the costs from previous stages “roll over” into the next. This requires a high level of “systemic integrity” because a small error in Stage A will snowball into a massive valuation error by Stage C.

Conclusion: Key Takeaways
- Job-Order Costing is a “Actual Record” system. It provides immediate answers to: “How much did this specific task cost us right now?”
- Process Costing is a “Logical Design” system. It answers: “What is the average efficiency and cost-per-unit of our entire operation?”
- Strategic Choice: Use Job-Order for high-margin, custom projects where accuracy per unit is king. Use Process Costing for high-volume environments where “economies of scale” and administrative simplicity are the priorities.
AI Disclosure: Created in collaboration with Google Gemini. All core content was authored, reviewed, and edited by the author.