
Traditional Cost-Volume-Profit (CVP) analysis operates on rigid, textbook assumptions: it presumes that unit selling prices and variable costs remain perfectly constant, and that every single item produced is immediately sold out. However, the real-world business ecosystem is rarely that accommodating.
In practice, cost functions warp unexpectedly alongside volatile raw material prices. Profit margins constantly oscillate due to shifting sales volumes across diverse product portfolios, and factory utilization rates frequently disrupt the break-even point in real-time due to operational efficiencies and inefficiencies.
Relying entirely on simple, static Excel spreadsheets is no longer enough. To control uncertainty and run accurate profit simulations within the boundaries of restricted production capacities and distribution networks, corporate leaders must adopt an advanced, practical CVP strategy. As artificial intelligence fundamentally reshapes cost accounting frameworks, we must take a deep look into the mathematical logic and AI-driven methodologies behind the five most critical cost management challenges faced by modern finance teams.
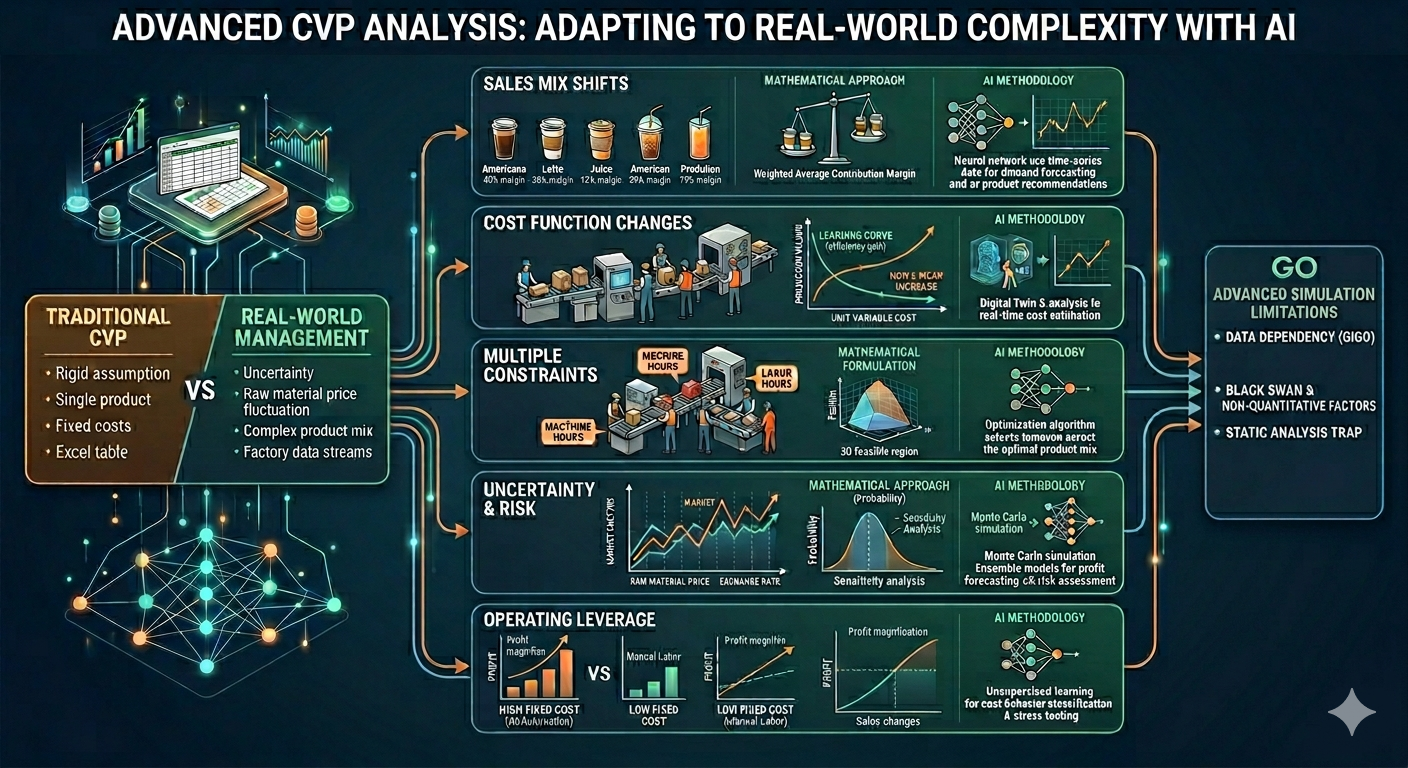
1. Multi-Product Environments: Managing Sales Mix Volatility
The Practical Operational Challenge
Modern companies rarely sell just a single product. Consider a popular local coffee shop chain: if the sales ratio between high-margin black coffees and low-margin seasonal fruit smoothies deviates from the initial quarterly forecast, the business can easily plunge into a financial deficit—even if total top-line revenue hits the target exactly. This fluctuation in the proportion of different products sold is the first major structural risk that can completely invalidate a standard break-even forecast.
The Advanced Mathematical Approach: Weighted-Average Contribution Margin
To establish a mathematically sound break-even point across a diverse product line, businesses must combine individual product margins based on their historical sales proportions. This process effectively bundles separate items into a single, standardized “composite unit.”
For example, if data shows that Americanos and Caffè Lattes consistently sell at a 3:1 ratio, the finance team defines one composite unit as “3 Americanos + 1 Latte.” By dividing the company’s total fixed overhead by the combined contribution margin of this composite unit, management can determine the exact number of product packages required to break even. From there, the composite total is multiplied back by individual product ratios to establish precise baseline sales targets for each item.
The AI-Driven Methodology: Time-Series Demand Forecasting and Recommendation Engines
While traditional mathematics assumes that a sales mix stays perfectly stagnant, real-world customer demand shifts daily based on micro-trends. Modern finance teams leverage AI models built on Long Short-Term Memory (LSTM) or Transformer architectures to run real-time demand simulations influenced by weather patterns, weekends, and social media trends.
Furthermore, by integrating personalized recommendation algorithms into front-end marketing platforms, companies can actively promote high-margin items to consumers. This allows management to strategically steer the sales mix in a direction that optimizes corporate profitability.
2. Efficiency and Learning Curves: Adapting to Evolving Cost Functions
The Practical Operational Challenge
Standard CVP models assume that producing the 10,000th unit costs exactly the same as producing the 1st unit. In reality, variable costs per unit are highly dynamic. As factory workers repeat tasks, they benefit from a distinct learning effect, which heightens operational efficiency and lowers labor costs.
Conversely, if a plant pushes past its maximum sustainable utilization rate, it triggers massive operational inefficiencies, such as equipment overheating, machinery breakdowns, and expensive overtime pay. These factors cause the underlying cost function to behave non-linearly.
The Advanced Mathematical Approach: Non-Linear Cost Functions and Learning Curve Models
To reflect these shifts in production efficiency, advanced frameworks replace straight lines with mathematical curves. By incorporating specific “learning rates” into cumulative average-time models, analysts map out how variable costs decrease during peak efficiency cycles.
When production volumes cross a critical threshold into over-utilization, the formula accounts for a sharp, exponential rise in variable costs. Translating these non-linear behaviors into distinct geometric curves allows corporate analysts to isolate multiple break-even thresholds across different production volumes.
The AI-Driven Methodology: Non-Linear Cost Estimation and Dynamic Digital Twins
Actual factory floors rarely experience perfectly smooth, predictable cost curves. To capture real-world irregularities, enterprises deploy Neural Network-based non-linear regression models trained on IoT sensor data from smart factories and historical ledger expenses.
By building a dynamic “Digital Twin”—a virtual replica of the physical production system—management can instantly simulate the exact cost function changes that would occur if they accepted a massive, last-minute manufacturing order. This gives executives a precise operational ceiling, showing exactly where production efficiency maxes out before costs begin to spiral.
3. Resource Bottlenecks: Optimizing Under Multiple Constraints
The Practical Operational Challenge
There are times when market demand for a product is practically limitless, but a business is held back by physical operational bottlenecks. A manufacturing plant might suffer from a shortage of core machinery, or a software firm might run out of senior engineering hours. When multiple operational barriers exist simultaneously, leadership faces a tough decision: how should they allocate limited operational resources across various products to maximize corporate returns?
The Advanced Mathematical Approach: Linear Programming and Feasible Regions
When a business faces only one constraint, the solution is simple: prioritize the product that delivers the highest contribution margin per unit of that limited resource. However, when a company confronts multiple overlapping constraints—such as limited labor hours, raw material shortages, and restricted distribution networks—it must apply a mathematical optimization technique known as Linear Programming.
The finance team builds an optimization model where the primary objective is to maximize total contribution margin. They plot each individual resource limit as a mathematical boundary line. Together, these boundaries chart a specific multi-dimensional space known as the Feasible Region. By mathematically evaluating the vertices (corner points) of this geometric space, the model identifies the single, optimal production mix that yields the absolute highest possible net income.
4. Market Volatility: Managing Risk Under High Uncertainty
The Practical Operational Challenge
In volatile economic environments, core business metrics are constantly changing. Raw material prices can spike unexpectedly due to supply chain disruptions, or aggressive competitor pricing might force a company to slash its retail rates. When selling prices, variable costs, and fixed overhead are all moving parts, relying on a single, static break-even calculation introduces severe financial blind spots.
The Advanced Mathematical Approach: Probability Models and Sensitivity Analysis
To navigate this volatility, advanced management accounting treats future performance as a spectrum of probabilities rather than a single, rigid figure. Analysts conduct rigorous sensitivity analyses to measure exactly how violently the break-even point shifts when core variables change by a specific percentage.
By assigning historical probability distributions to projected sales volumes, companies can move beyond calculating a simple break-even point. Instead, they can explicitly quantify corporate risk by answering questions like: “Statistically, what is the exact probability that our organization will experience an operating loss next fiscal year?”
The AI-Driven Methodology: Monte Carlo Simulations and Machine Learning Ensemble Models
Real-world market factors like currency exchange rates and commodity prices do not follow perfect, textbook bell curves. To model this chaos, AI engines process decades of macroeconomic indicators and execute tens of thousands of automated Monte Carlo simulations.
By generating random variables across countless market conditions, the system maps out a comprehensive visual distribution of potential profit outcomes. Furthermore, machine learning ensemble models, such as XGBoost, analyze these simulated results to calculate the precise probability of financial losses under specific market stress scenarios.
5. Structural Cost Transformation: Controlling Operating Leverage
The Practical Operational Challenge
As enterprises adopt cloud automation and artificial intelligence systems, their internal cost structures undergo a profound transformation. Variable labor expenses decrease, but fixed software subscriptions, technology licensing fees, and equipment leases increase dramatically. This structural pivot toward high fixed costs triggers a powerful financial phenomenon known as Operating Leverage. When a company’s operating leverage is high, a small increase in revenue can send profits soaring—but a minor sales drop can plunge the entire business into a severe cash deficit.
The Advanced Mathematical Approach: Cost Elasticity Functions
Operating leverage behaves exactly like a mechanical lever in physics or an elasticity function in economics. It measures the precise multiplier effect showing how fast operating income expands or contracts relative to changes in sales revenue.
To quantify this structural risk, analysts calculate the Degree of Operating Leverage (DOL) index by comparing a company’s contribution margin against its final net operating income at a specific sales volume. A high DOL index serves as a constant structural warning to executives, proving mathematically that even a minor market downturn could trigger catastrophic losses due to unyielding fixed overhead.
The AI-Driven Methodology: Unsupervised Clustering for Cost Behavior Reclassification
Traditional accounting relies on rigid classifications, splitting costs cleanly into fixed or variable buckets. In modern operations, however, many expenses manifest as “semi-fixed” or “step-variable” costs—such as cloud computing fees that jump up only after crossing specific data thresholds—which can easily distort traditional leverage calculations.
To solve this, advanced corporate data systems route all enterprise resource planning (ERP) transactions through unsupervised machine learning clustering and anomaly detection algorithms. The AI identifies hidden behavioral patterns within corporate expenses, reclassifying them based on actual operational data rather than rigid accounting definitions, and executes automated stress tests to see how fixed overhead will hold up against sudden revenue shocks.
6. Embedded Limitations of Advanced Simulation Models
While advanced mathematical modeling and artificial intelligence significantly reduce operational blind spots, executives must remain deeply aware of the structural limitations inherent to the CVP framework itself:
- Data Dependencies and the GIGO Principle: AI-driven cost estimations are entirely dependent on the volume, accuracy, and granularity of historical data. If a company’s internal ERP records are messy, or if expense invoices are improperly categorized, the old adage “Garbage In, Garbage Out” (GIGO) takes over. The algorithms will simply output highly polished, mathematically sophisticated, yet dangerously inaccurate break-even points.
- The Blind Spot of Black Swan Events: Machine learning models and probability frameworks look at the future through the lens of historical data patterns. Consequently, they are structurally incapable of predicting “Black Swan” events—such as abrupt geopolitical crises, unexpected regulatory overhauls, or sudden global supply chain freezes. These non-quantifiable variables are completely left out of mathematical equations.
- The Trap of Short-Term Static Snapshots: At its core, CVP analysis is a tactical, short-term decision-making tool. Even when augmented with dynamic AI cost tracking, it still provides a relatively static snapshot of a specific operational window. If management focuses exclusively on maximizing short-term contribution margins, they might aggressively cut vital R&D spending and long-term capital investments, inadvertently destroying the company’s long-term market competitiveness.
Conclusion: Key Takeaways for Corporate Leaders
To build a resilient enterprise in a volatile market, management teams must elevate their financial planning from basic accounting into a predictive, strategic asset.
- Move Beyond Flat Metrics: Abandon the assumption that cost functions are static linear equations. Use weighted averages for product portfolios and incorporate learning curves to account for operational scale.
- Synthesize Human Logic with AI Agility: Pair classic financial optimization tools like Linear Programming with real-time AI demand models to successfully navigate resource bottlenecks and changing consumer habits.
- Actively Manage Your Cost Structure: Track your Degree of Operating Leverage continuously. High-tech infrastructure lowers variable costs but introduces fixed overhead risks that must be balanced with robust cash cushions.
Ultimately, advanced CVP analysis is no longer just about tracking where your business stands today—it is about simulating alternative futures, identifying structural vulnerabilities before they hit the balance sheet, and building the financial agility needed to survive a corporate marathon.
AI Disclosure: Created in collaboration with Google Gemini. All core financial frameworks, advanced mathematical concepts, and corporate risk management strategies were authored, thoroughly reviewed, and edited by the author to ensure strict alignment with North American corporate finance standards.