
In the past, running a business was often treated like a short sprint—a relentless race focused entirely on running as fast as possible. In modern management, however, business is much more like a smart marathon. It requires calculating the uphills and downhills of the course and carefully pacing yourself. Far too many companies focus blindly on accelerating their top-line revenue, only to hit a steep uphill climb of massive fixed costs, lose their breath, and collapse.
Today, we live in an era where we must look past the glamorous facade of total sales and pierce through to a company’s structural core strength. We have to answer the ultimate question: “Exactly how many units must this business sell just to carry its own weight and start turning a real profit?”
In the worlds of accounting and corporate finance, the most powerful predictive weapon for simulating the relationship between sales, costs, and profits—allowing you to draw your future report card in advance—is CVP (Cost-Volume-Profit) Analysis.
1. Understanding CVP Through an Everyday Analogy
To appreciate the utility of CVP analysis, look no further than a local neighborhood food truck—a staple comfort-food business. Imagine running a gourmet taco truck. To figure out your daily financial health, you have to crunch the numbers.
While covering the daily costs of tortillas, meat, and propane gas, you also need to make enough money to pay off the truck’s daily rental fee. Calculating how many tacos you must grill tonight just to cover those expenses is exactly what CVP analysis does on a larger corporate scale.
Key Terms to Know
- Contribution Margin: In business, “contribution” means helping or giving toward a goal, and “margin” is the money left over. Therefore, this is total sales revenue minus total variable costs. It represents the actual dollars available to help “contribute” toward paying down fixed overhead and eventually generating net operating income.
- Unit Contribution Margin: This narrows the focus down to a single item—like one single taco. It is the selling price per unit minus the variable cost per unit. Every time you sell one item, this individual profit margin chips away at your fixed overhead.
- Contribution Margin Ratio: This expresses the contribution margin as a percentage of total revenue. If your taco truck brings in $1,000 in revenue and you have $600 left over after paying for ingredients and fuel, your contribution margin ratio is 60%.
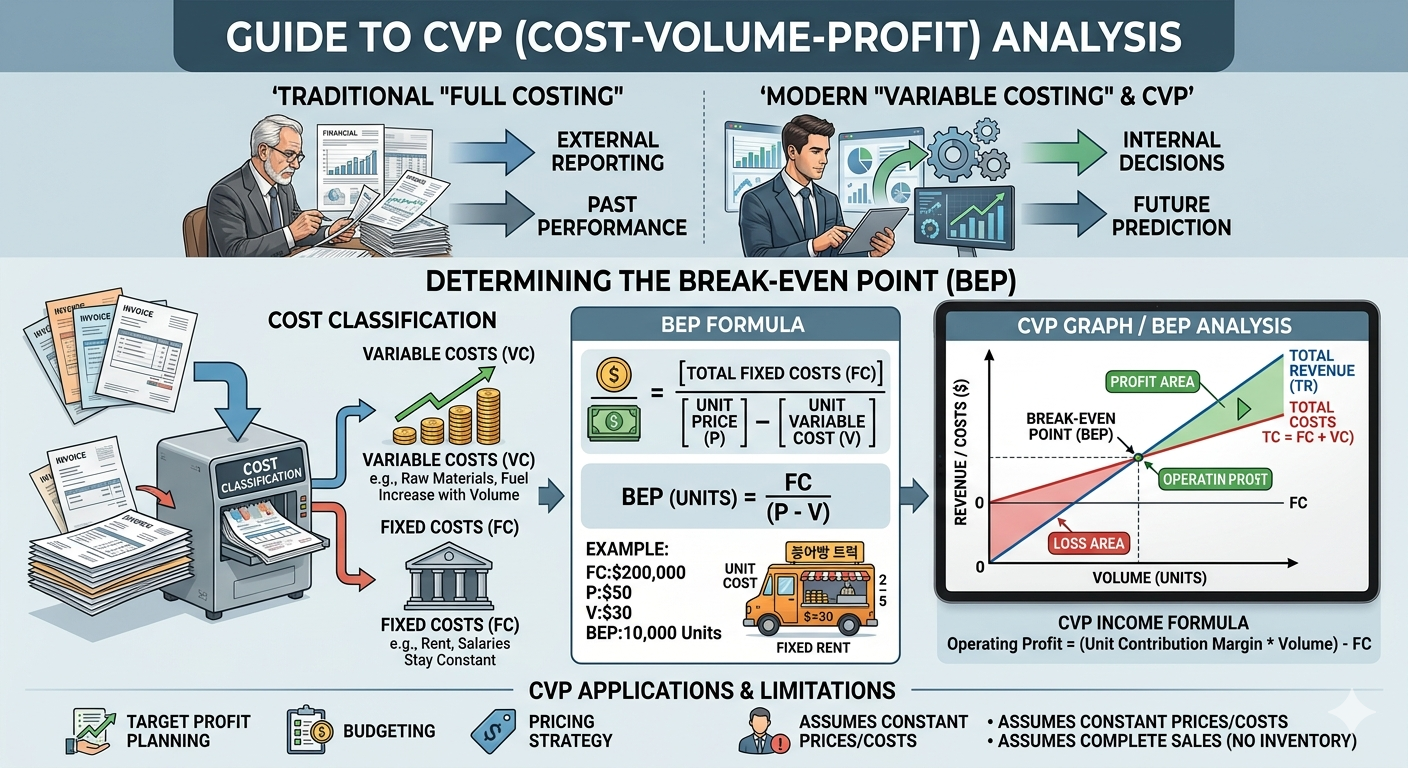
- Break-Even Point (BEP): This is the magical threshold where total revenue exactly equals total costs. There is no profit, but there is no loss either. It tells you the exact production or sales volume required to completely clear your expenses and hit net-zero.
The Foundation: 5 Core Assumptions of CVP Analysis
To simplify the messy complexities of the real world and provide clean predictions, CVP analysis relies on five strict foundational assumptions. If these rules are broken, the calculations become significantly more complicated:
- The Linearity Assumption: The selling price per unit and the variable cost per unit remain completely constant, regardless of changes in volume. (In other words, you do not offer volume discounts for bulk purchases).
- Clear Cost Classification: All operating expenses can be cleanly divided into two distinct categories: Fixed Costs (the overhead expenses you pay just for breathing) and Variable Costs (the expenses that scale directly with production).
- Production Equals Sales: Every single unit produced during the period is sold. There is no ending inventory sitting in a warehouse warping your expense reports.
- Single Product or Constant Sales Mix: The business either sells only one type of product, or, if it sells multiple items, the proportion in which they are sold remains perfectly constant.
- Stable Monetary Value: There are no major macroeconomic shifts, inflation spikes, or sudden technological disruptions during the analysis period that would alter cost structures.
2. The Core Framework: The Profit Equation and Target Profit Calculations
To apply CVP analysis to real-world business strategy, you must translate a company’s financial structure into a reliable mathematical equation. Fortunately, the logic is highly straightforward. It maps out how revenue, costs, and volume interact to create your net bottom line.
Deriving the Profit Equation
Operating income is calculated by subtracting total costs from total revenues, where total costs are the sum of variable costs and fixed costs.
Operating Income = Revenue – Total Costs
Operating Income = Revenue – (Variable Costs + Fixed Costs)
Using variables where p is the selling price per unit, v is the variable cost per unit, x is the sales volume in units, and F is total fixed costs, the formula looks like this:
Operating Income = (p × x) – (v × x) – F = (p – v)x – F
Since the Break-Even Point (BEP) is the exact volume where operating income equals zero, we can set the equation to zero and solve for x (Break-Even Units):
Calculating Target Profit
If a business owner wants to know exactly how many units must be sold to reach a specific financial goal, we can modify the equation by introducing a Target Income (TI) variable:
Operating Income = (p × x) – (v × x) – F = (p – v)x – F = TI
Calculating Target Profit
If a business owner wants to know exactly how many units must be sold to reach a specific financial goal, we can modify the equation by introducing a Target Income (TI) variable:
3. Real-World Applications and the Link to Variable Costing
Strategic Business Simulation
In corporate management, CVP analysis is not used to calculate pennies down to a perfect cryptographic certainty. Instead, it serves as a dynamic simulation guide for strategic direction.
When launching a new venture, pitching a product, or adjusting prices, CVP provides immediate clarity on your baseline margins. It acts as a core budgeting tool to forecast how a 5% reduction in material costs or a 10% price hike will ripple across the entire organization’s bottom line.
The Inseparable Bond with Variable Costing
CVP analysis cannot function without a reporting framework known as Variable Costing.
Unlike traditional absorption costing—which is required for external financial reporting and often distorts per-unit costs based on factory production levels—variable costing isolates fixed overhead from variable production inputs. Because variable costing links net income directly to actual sales volume, it aligns perfectly with the underlying mechanics of the CVP profit model. For internal decision-makers, these two frameworks are functionally inseparable.
4. Practical Limitations and Advanced Scenarios
The Pitfall of Over-Simplification
The primary limitation of CVP analysis stems from its rigid linearity assumption. In the real world, purchasing raw materials in massive volumes usually triggers bulk discounts, lowering variable costs.
Conversely, if a company is desperate to move stagnant inventory, it might slice retail prices, altering the revenue line. Additionally, dividing every single corporate line-item cleanly into a pure fixed or pure variable bucket is incredibly difficult in complex corporate ecosystems.
Advanced Real-World Scenarios
Modern corporate finance addresses these limitations by adjusting the CVP model to handle four distinct real-world complexities:
- Sales Mix Shifts: Most companies sell a variety of products with different profitability metrics. For instance, a coffee shop makes high margins on black drip coffee but lower margins on complex specialty lattes. If consumers suddenly shift their buying habits, the overall break-even point shifts too. To manage this, finance teams bundle products based on a constant historical ratio to calculate a Weighted-Average Contribution Margin.
- Operating Under Constraints: In production, capacities are rarely infinite. Companies routinely face bottlenecks such as limited machine hours, labor shortages, or raw material scarcity. When constraints exist, maximizing profits isn’t about pushing the item with the highest absolute margin; it requires prioritizing the products that generate the highest contribution margin per unit of the constrained resource.
- Managing Uncertainty (Sensitivity Analysis): Future prices and overhead expenses are volatile. To protect against risk, analysts use sensitivity analysis—often called “What-If” profiling. They simulate scenarios like: “What happens to our cash cushion if supply chain issues push variable costs up by 7% while consumer demand drops by 12%?”
- Operating Leverage Risk: This measures how sensitive a company’s operating income is to organizational sales fluctuations, driven entirely by its cost structure. High-overhead businesses (like manufacturing plants or tech firms with massive R&D) have high operating leverage. A small bump in sales can send net profits skyrocketing, but a minor dip in revenue can plunge the firm straight into a severe deficit.
5. Summary: Traditional Accounting vs. CVP-Driven Thinking
| Category | Traditional Absorption Accounting | CVP-Driven Management Thinking |
| Cost Lens | Is the expense classified as manufacturing or administrative overhead? | Is the expense Fixed (static overhead) or Variable (scales with volume)? |
| Primary Metric | Gross Profit Margin (Revenue – Cost of Goods Sold) | Contribution Margin & Unit Contribution Margin |
| Core Limitation | Can distort unit costs based on artificial factory production swings | Over-simplifies real-world volume discounts and dynamic pricing |
| Strategic Value | Historical scorecard for compliance, tax filings, and audited GAAP financials | Forward-looking toolkit for break-even forecasting and risk simulation |
Conclusion: Key Takeaways
While traditional financial statements are necessary to report historical performance to external stakeholders, CVP analysis acts as the ultimate forward-looking dashboard for internal leaders.
- Look Past Top-Line Sales: High gross revenue means nothing if a company’s structural fixed costs are too heavy to carry during economic downturns.
- Focus on the Contribution Margin: Understanding your unit contribution margin is the only way to accurately calculate risk, set baseline prices, and map out sustainable expansion.
- Simulate Before Executing: Use CVP equations to test operational vulnerabilities against market variables before committing capital to new initiatives.
Piercing through top-line revenue to inspect the underlying cost behavior and contribution margin ratios is what separates speculative businesses from truly resilient, scalable enterprises.
AI Disclosure: Created in collaboration with Google Gemini. All core financial content was authored, thoroughly reviewed, and edited by the author to ensure compliance with North American corporate accounting and management standards