
“What is the break-even point for a single patient visit at our clinic?”
Traditional accounting methods often take a “one-size-fits-all” approach, simply dividing total overhead by the number of patients. However, a patient with a common cold consumes vastly different resources than one requiring surgery or specialized diagnostics. By tracing the journey from Resources to Activities and finally to the Patient, Activity-Based Costing (ABC) reveals the true economic footprint of medical care. In this analysis, we will deconstruct a real-world scenario to calculate the precise unit cost of a typical outpatient visit and determine the minimum viable billing amount.
1. Practical Case Study: Calculating the True Cost for “Patient X”
To find the real cost of treating a patient with common cold symptoms—let’s call him Patient X—we must follow a rigorous three-step allocation process.
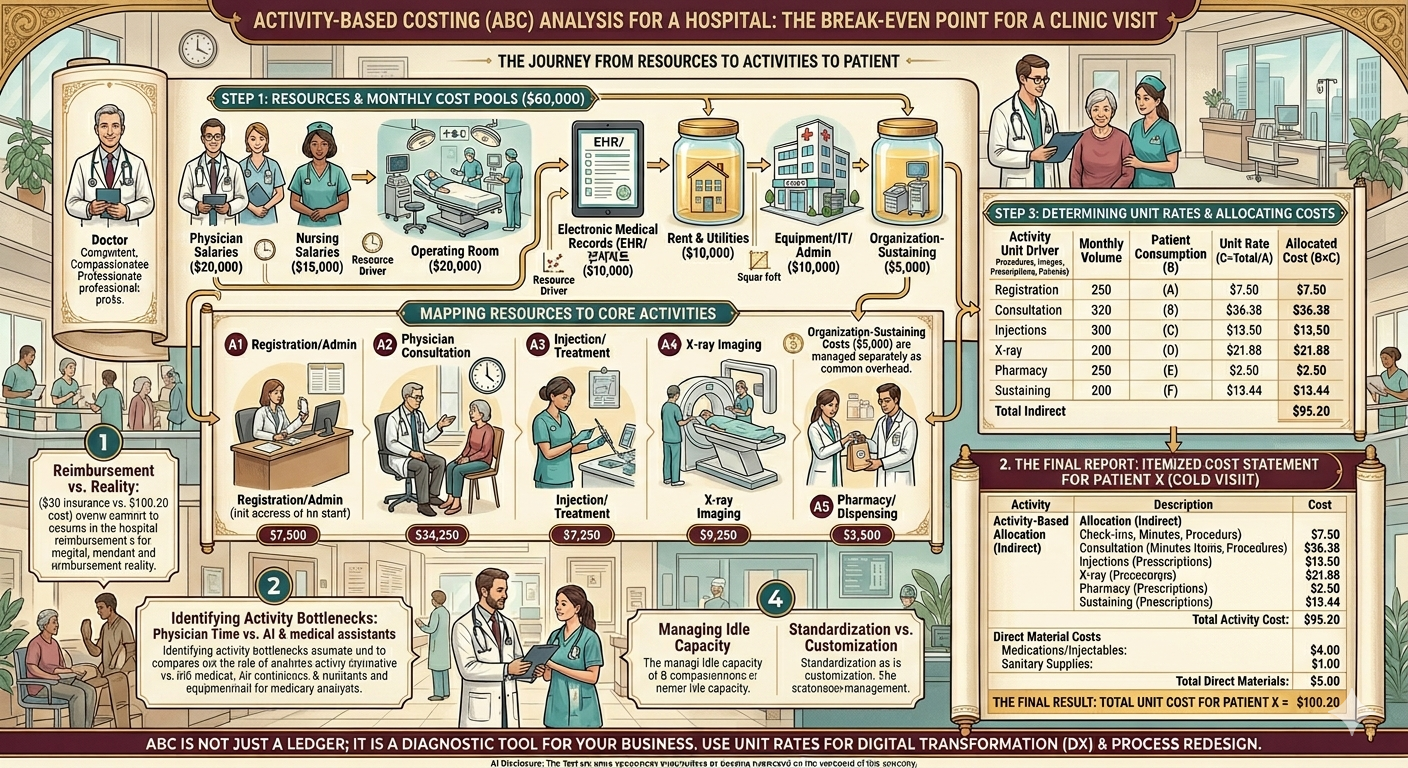
Step 1: Aggregating Resource Pools
First, we identify the total resources spent by the clinic in a single month ($60,000) and define the “Resource Drivers” used to distribute these costs.
| Resource Item | Monthly Amount | Allocation Basis (Resource Driver) |
| Physician Salaries | $20,000 | Consultation & Prescription Time |
| Nursing Salaries | $15,000 | Treatment & Care Activity Time |
| Rent & Utilities | $10,000 | Square Footage (sq. ft.) |
| Equipment/IT/Admin | $10,000 | Usage & Administrative Time |
| Organization-Sustaining | $5,000 | Total Patient Count (Equal Spread) |
Step 2: Mapping Resources to Activities
Next, we determine what percentage of each resource is consumed by specific core activities. This “Activity Mapping” turns raw expenses into functional costs.
- A1. Registration/Admin: $7,500
- A2. Physician Consultation: $24,500
- A3. Injection/Treatment: $7,250
- A4. X-ray Imaging: $9,250
- A5. Pharmacy/Dispensing: $2,500
- (Note: Organization-sustaining costs are managed separately as common overhead.)
Step 3: Determining Activity Unit Rates
The clinic sees 800 patients a month, but not everyone gets an X-ray or an injection. We must calculate the “Cost per Activity Unit” by dividing the total activity cost by the actual volume of that activity.
| Activity Item | Total Activity Cost | Driver Unit | Monthly Volume (A) | Patient Consumption (B) | Unit Rate (C=Total/A) | Allocated Cost (B×C) |
| Registration | $7,500 | Check-ins | 1,000 | 1 | $7.50 | $7.50 |
| Consultation | $24,250 | Minutes | 10,000 | 15 mins | $2.425 | $36.38 |
| Injections | $6,750 | Procedures | 500 | 1 | $13.50 | $13.50 |
| X-ray | $8,750 | Images | 400 | 1 | $21.875 | $21.88 |
| Pharmacy | $2,000 | Prescriptions | 800 | 1 | $2.50 | $2.50 |
| Sustaining | $10,750 | Patients | 800 | 1 | $13.44 | $13.44 |
| Total Indirect | $60,000 | — | — | — | — | $95.20 |
2. The Final Report: Itemized Cost Statement for Patient X
By combining the allocated activity costs (indirect) with the specific supplies used (direct), we arrive at the total economic cost for this specific visit.
Activity-Based Allocation (Indirect Costs)
- Registration & Admin: $7.50 (Covers check-in and documentation)
- Physician Consultation: $36.38 (Based on a 15-minute exam)
- Injection Treatment: $13.50 (Covers clinical labor and prep)
- X-ray Imaging: $21.88 (Covers equipment depreciation and space)
- Pharmacy/Dispensing: $2.50 (Covers pharmacist time)
- Organization-Sustaining: $13.44 (Share of rent/HQ costs)
- Total Activity Cost: $95.20
Direct Material Costs
- Medications/Injectables: $4.00 (Actual cost of pharmaceuticals)
- Sanitary Supplies: $1.00 (Gauze, alcohol, disposables)
- Total Direct Materials: $5.00
The Final Result: Total Unit Cost for Patient X = $100.20
3. Structural Limitations and Challenges in ABC Implementation
While the $100.20 figure is enlightening, managers must recognize the inherent hurdles in the ABC process:
- Subjectivity in Resource Mapping: Determining that a physician spends exactly 90% of their time on consultations is often based on self-reporting. If staff misestimate their time to appear busier, the entire cost pool becomes distorted from the start.
- Arbitrary Allocation of Sustaining Costs: Costs like hospital branding or the Director’s salary have no direct causal link to a patient visit. Whether you divide these by patient count or revenue, it remains a “best guess” rather than a precise measurement.
- Operational Complexity: Tracking every minute of consultation or every cotton ball used requires a level of data discipline that can be more expensive to maintain than the value of the information provided. This is the “cost-of-the-costing-system” dilemma.
- The Paradox of Idle Capacity: If the clinic is empty, the fixed costs are spread over fewer patients, making the “cost per patient” skyrocket. This can send a false signal to increase prices when, in fact, the issue is low volume and underutilized resources.
4. Executive Insights: Strategic Decision-Making
A CEO should look past the $100.20 figure to understand the underlying “Management Map” it provides:
- Reimbursement vs. Reality: If the national insurance reimbursement for a cold visit is only $30, but the ABC cost is $100, the clinic is losing $70 per visit. Managers must decide whether to treat this as a “loss leader” to attract patients for high-value services or to radically innovate the process.
- Identifying Activity Bottlenecks: Physician consultation accounts for a massive chunk of the cost. If doctors are spending time on repetitive explanations, shifting that activity to AI chatbots or medical assistants can reallocate expensive resources to higher-value specialized care.
- Managing Idle Capacity: A high unit cost during low-volume periods is a management failure, not a patient failure. Instead of raising fees, the strategy should focus on optimizing appointment schedules and marketing to increase utilization and lower the cost per unit.
- Standardization vs. Customization: The fact that Patient X took 15 minutes instead of the average 10 minutes drove costs up. Standardizing clinical pathways can control resource consumption, while offering “premium” customized paths can allow for tiered pricing models.
Conclusion: A Final Thought for the Healthcare Leader
ABC is not just a ledger of what was spent; it is a diagnostic tool for your business. It identifies where you are wasting resources and where you are truly generating value. Use these activity rates as the foundation for Digital Transformation (DX) and process redesign to ensure your institution remains financially resilient in a shifting healthcare market.
AI Disclosure: Created in collaboration with Google Gemini. All core content was authored, reviewed, and edited by the author.