
Imagine a factory where standardized products—like ramen noodles or bottled beverages—pour out endlessly. As thousands of items whiz by on a conveyor belt, a manager might suddenly wonder: “At this very moment, what is the value of those half-finished products on the belt?”
In a mass-production environment, it is physically impossible to track the cost of every single unit individually. Instead, we aggregate all costs incurred across an entire Process and then distribute them fairly among the outputs remaining at the end of the period. However, this poses a challenging question: How do we allocate costs between fully finished goods and those that have only just begun to take shape?
Today, we explore the logic of Equivalent Units (EU), the fundamental answer to this problem.
1. The Logical Vessel of Process Costing: The Process
In process costing, the focus is on “where” the product passes through. Data flows horizontally. Instead of tracking individual items, we pour all expense receipts for a specific period into a large “vat” represented by a department or a stage. Within this flow, the manager’s most critical task is to determine the value of unfinished products—known as Work-in-Process (WIP)—left at the end of the period.
2. Physical Flow vs. Equivalent Units
When dealing with WIP in process costing, we must strictly distinguish between two types of figures:
1) Whole Units (Physical Flow): “The Count as You See It”
- Physical Quantity Tracking: This involves counting every “unit” in the process as one, regardless of its completion status. For example, 100 fully baked loaves of bread and 100 lumps of dough are both counted as 100 physical units.
- Role: This serves as the foundation for “Quantity Verification,” ensuring that Beginning Inventory + Units Started equals Units Completed + Ending Inventory.
2) Equivalent Units (EU): “The Count of Cost-Incurred Effort”
- Economic Value Conversion: This reinterprets the costs sunk into unfinished products by asking: “If these were finished products, how many could we have completed with the same effort?” For example, 100 units that are 50% complete are viewed as being equivalent to 50 finished units.
- Role: EU acts as the “calculation unit” used to reasonably allocate costs like materials and conversion, which are often injected at different times. This allows us to calculate the Cost per Unit.

3. A Deeper Look into Equivalent Units
Equivalent Units are more than just simple arithmetic; they are a way of synchronizing the timing and speed of resource injection into a numerical format.
- Conversion into Value-Based Quantity: The core idea is to translate the volume of resources held within unfinished products into units of finished goods. Even if there are 20 physical bags on the line, if they are only halfway through the process, we treat them as 10 “Equivalent Units” from an accounting perspective.
- A Tool for Allocation: In process costing, no one knows the exact cost until the period ends and the calculators come out. Equivalent Units serve as the “denominator” used to divide the total cost between finished goods and WIP.
4. The Consequences of Ignoring Equivalent Units
What illogical outcomes would occur if we ignored this concept and simply allocated costs based on physical counts?
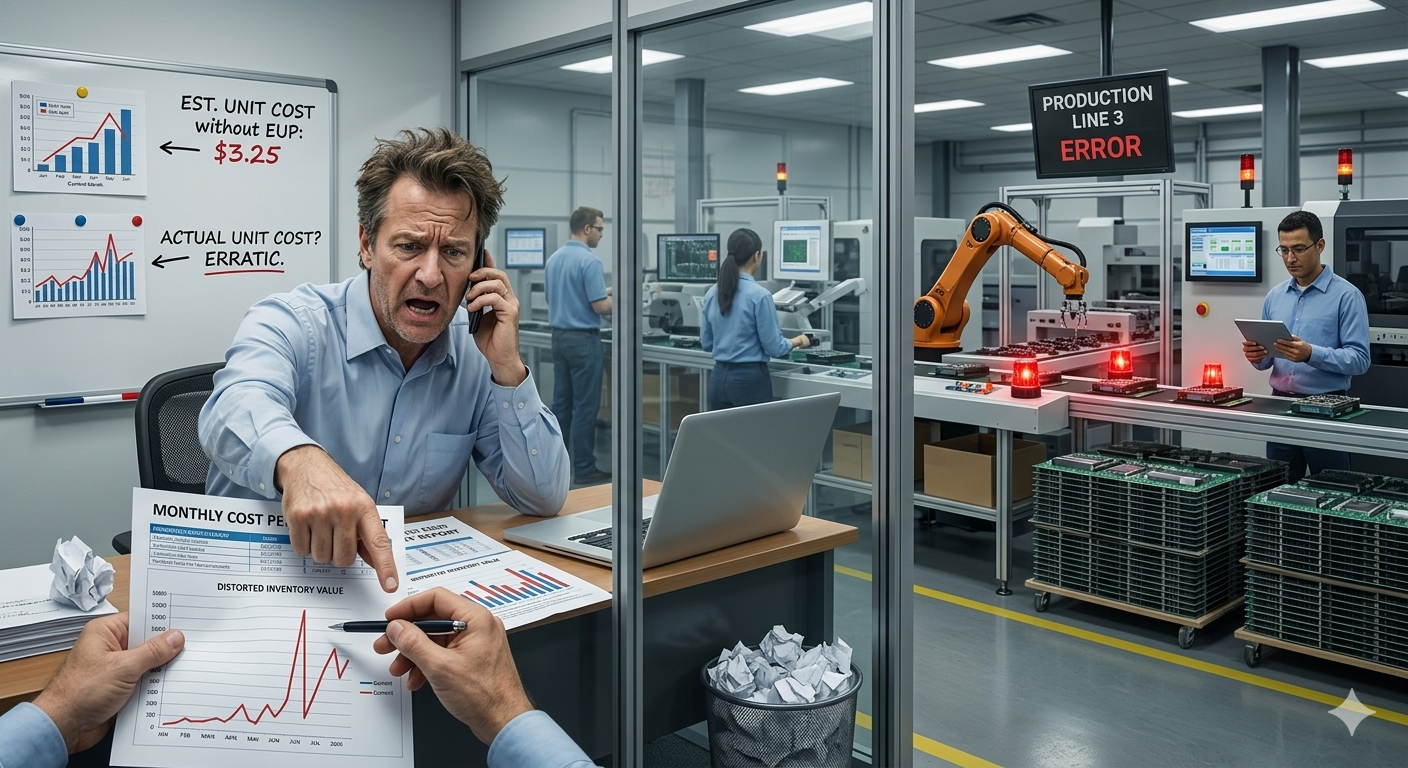
- Cost Volatility (The “Jumping” Effect): Suppose you spend $170,000 this month to finish 80 units while 20 units are left half-finished. Without EU, you’d divide by 100, resulting in a unit cost of $1,700. If next month you spend the same $170,000 but finish all 100 units, the unit cost drops to $1,400. Even if factory efficiency remains identical, the product price “dances” based on how much inventory is left over.
- Distortion of Profit: Assigning the same cost to 20 unfinished units as to 20 finished units inflates asset (inventory) value and understates expenses, leading to artificially high reported profits. Conversely, valuing WIP at zero would make the month look like a massive loss.
- Conclusion: Equivalent Units act as a fair scale, ensuring that costs are shared appropriately so that assets are not inflated and expenses are not unfairly suppressed.
5. Detailed Explanation: The “Cost Jumping” Phenomenon
Let’s look closer at why the unit cost fluctuates wildly without EU:
- Month 1: 80 Finished + 20 Units (at 50% progress)
- Cost Incurred: $170,000
- Naive Method: Divide by 100 physical units.
- Calculation: $170,000 / 100 = $1,700
- Phenomenon: Even though you worked hard on 100 items, because only 80 were “finished,” the unit cost feels artificially high.
- Month 2: Finishing the remaining 20 + starting new units
- Cost Incurred: $170,000 (same as before)
- Units Completed: 120 (20 carried over + 100 new)
- Calculation: $170,000 / 120 = $1,416
- Phenomenon: The factory’s efficiency (skill, machine performance) hasn’t changed, but because you finished the “half-done” items from last month, this month’s performance looks much better.
Conclusion: This is a true “jumping” effect. Without EU, Month 1 looks expensive ($1,700) because progress wasn’t recognized, while Month 2 looks cheap ($1,400) by taking credit for previous work.
6. The Challenges in Calculating Accurate Equivalent Units
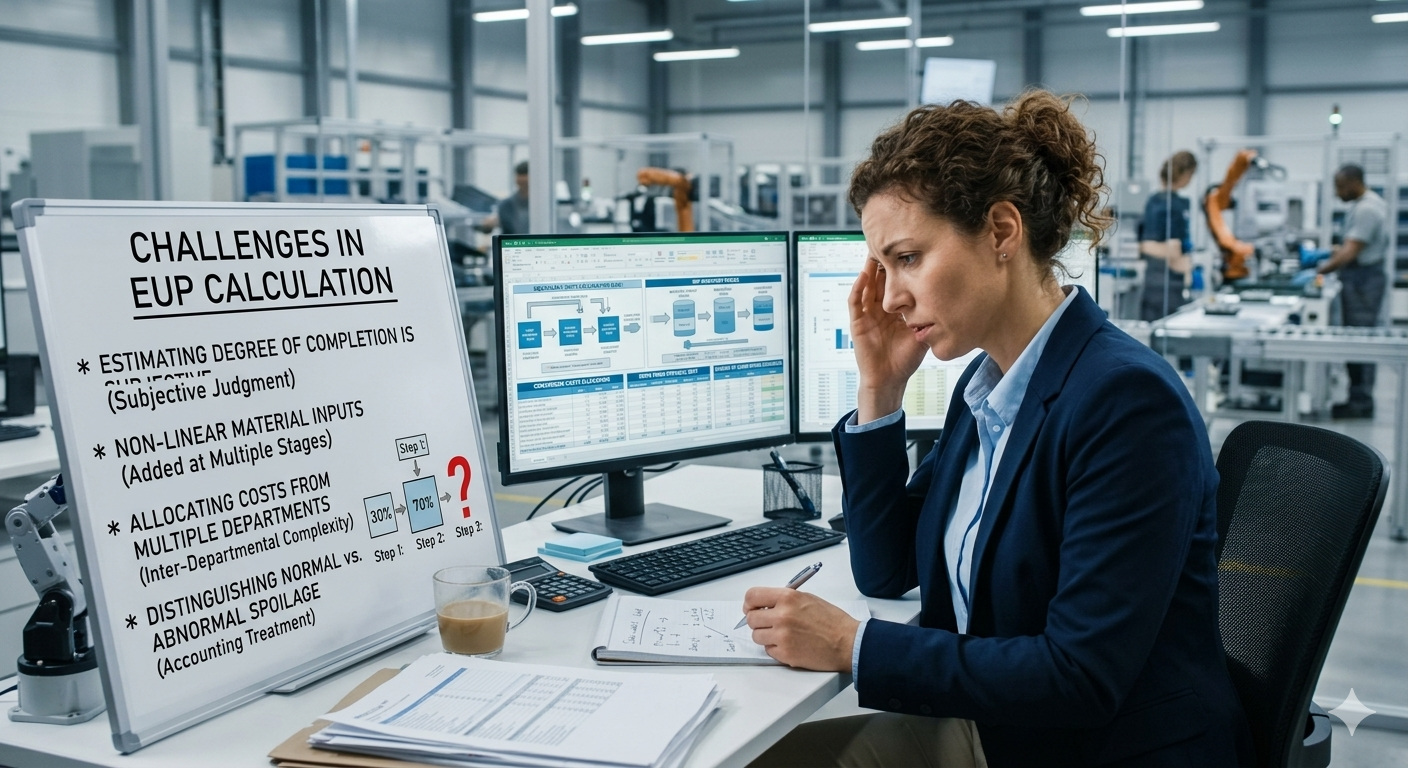
While the theory is clear, calculating precise EU in a real manufacturing setting requires difficult managerial judgment.
- Subjectivity in Progress Estimation: Determining exactly what percentage mark thousands of semi-finished products have reached on a conveyor belt can be highly subjective. If this estimate is off, the reliability of the entire cost dataset collapses.
- Non-Linear Material Inputs: Not all materials are added at the start. If secondary materials (like seasoning in ramen) or packaging are added mid-way or at the very end, separate EU logic must be designed for each cost element.
- Spoilage and Defects: Management must decide at what point lost or damaged units (spoilage) are entitled to a share of the accumulated costs.
7. Differential Application by Cost Element: Materials vs. Conversion
To calculate EU accurately, we must distinguish how resources enter the process.
- Direct Materials (Front-Loaded): Like adding flour at the very start of ramen production. Once the process begins, 100% of the material is already there. Thus, the EU for materials often equals the total physical count, regardless of the product’s physical progress.
- Conversion Costs (Uniformly Incurred): Costs like labor and electricity accumulate steadily throughout the process. Since they pile up in proportion to time and effort, EU for conversion must be recognized in direct proportion to the stage of completion (percentage).
Example of Differentiating Materials and Conversion
Suppose 100 units of WIP are 50% complete at the end of the month.
| Cost Element | Status | Equivalent Unit Calculation |
| Materials | All flour was added at the start. | 100 Units (100% complete for materials) |
| Conversion | Only half the baking time has passed. | 50 Units ($100 \times 50\%$) |
If you bundled these as an “average of 75%,” material costs would be understated and conversion costs would be overstated. To find the true Cost per Unit, you must calculate them separately:
- Material Cost per Unit = Total Material Cost / Material EU
- Conversion Cost per Unit = Total Conversion Cost / Conversion EU
Only by adding these separate unit costs can you determine the true value of Ending WIP and the accurate cost of Finished Goods.
8. Conclusion: Key Takeaways
- Logic of Allocation: Process costing is a system of logical distribution through Equivalent Units, not just a record of expenses.
- Denominator Accuracy: EU serves as the denominator for cost allocation; if this number is wrong, product costs and inventory values are compromised.
- Systemic Integrity: Calculating EU is the process of defining the “stake” of unfinished products, enabling accurate performance measurement within economies of scale.