
In our last session, we explored the surgical precision of Job Order Costing, which translates every unique customer whim and specialized order into specific numbers. Tracking the resources for a single custom suit or a massive vessel requires the meticulousness of a master craftsman. However, when a manager’s vision shifts toward global markets, “High Volume/Low Margin,” and “Economies of Scale,” the paradigm of cost accounting undergoes a radical transformation.
Imagine a Coca-Cola bottling plant churning out dozens of bottles per second, an ExxonMobil refinery continuously processing crude oil in massive tanks, or an Intel fab moving semiconductor wafers along an endless conveyor belt. In these environments, asking, “How much electricity went into this specific bottle?” is not only impossible but managerially meaningless. Individual “Jobs” disappear, leaving only the unceasing flow of the “Process.”
1. What is a “Process”?: The Station Where Cost Accumulates
In this system, the fundamental unit of measurement is the Process. This refers to a sequence of standardized operational steps that a product must pass through to reach completion.
- The Definition: A standardized sequence of operations (e.g., Mixing → Baking → Packaging).
- The Character: Each process serves as an independent Cost Center. This creates a “Cumulative Structure” where costs passed from a previous process become the “Raw Material” (known as Transferred-in Cost) for the next stage.
2. Process vs. Job: Deciphering the Difference
While these terms might sound similar to the untrained ear, from a cost accounting perspective, the “vessels” used to store data are fundamentally different.
1) Job: A Unit with “Individual Identity”
A Job represents a specific customer order or a unique project.
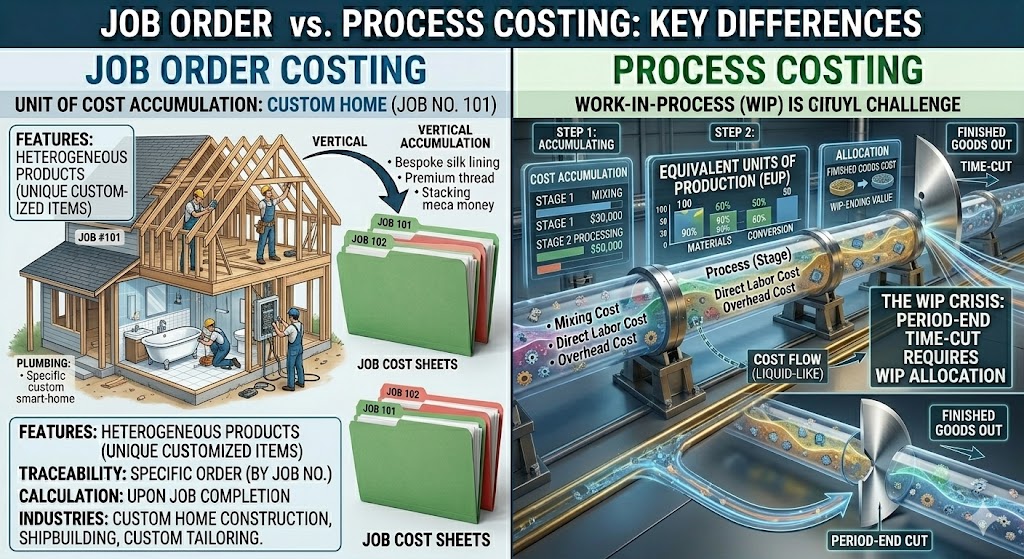
- Character: Every job has a unique ID (e.g., Job No. 101).
- The Core: Because materials and time vary per item, the question “Whose order is this?” is paramount.
- Data Structure: Costs are stacked Vertically (Separate ledgers for Client A and Client B).
- The Analogy: A custom-tailored suit. Every suit has different measurements, so you keep a separate envelope (ledger) for each to hold the receipts.
2) Process: A Station in a “Continuous Flow”
A Process represents a standardized stage of production.
- Character: Products “pass through” the stage (Mixing → Heating → Packaging).
- The Core: Rather than individual identity, the focus is: “How much did we spend in total at this specific stage?”
- Data Structure: Costs flow Horizontally (Costs from Process A move to Process B).
- The Analogy: A water filtration system at a bottling plant. You don’t attach a receipt to every drop of water; instead, you calculate the total cost of running the filtration system for a month.

3) At a Glance: Key Differences
| Feature | Job Order Costing | Process Costing |
| Primary Focus | “What” is being made? | “Where” is it passing through? |
| Tracking Object | Specific Order / Customer | Specific Department / Stage |
| Cost Document | Job Cost Sheet | Production Report |
| Homogeneity | Heterogeneous (Unique items) | Homogeneous (Identical items) |
| Calculation Timing | When the job is finished | At the end of the period (En masse) |
3. The “Biz-Insight”: Why is Process Costing More Complex?
The absolute necessity of allocating total costs between finished goods and work-in-process leads to the “Dilemma of the WIP.”
- In Job Costing, if a job isn’t finished, you simply look at its ledger. “Job 101 is still in progress? Okay, the $1M recorded here is our WIP.” Problem solved.
- In Process Costing, there are no individual ledgers. Costs flow through a massive pipeline like a liquid. When you “cut” the pipe at the end of the month, you must logically estimate how many “liters” of liquid are inside and what they are worth. This requires a sophisticated concept called Equivalent Units of Production (EUP).
Ultimately, Job Costing is the “Sum of Individual Receipts,” while Process Costing is the “Science of Averages.”
4. Why Use “Averages” Over a “Specific Period”?
The heart of Process Costing lies in the Average Method calculated at period-end. Why bundle everything together?
- Homogeneity of Products: Every item produced is identical in specification and quality. There is no reason for Bottle #1 to have a different cost than Bottle #1,000. Tracking them individually would be a colossal waste of resources.
- Continuous Flow: Because the line never stops, it is difficult to draw a hard line and say, “This specific unit is done.” Therefore, dividing the total costs incurred over a period (e.g., one month) by the total output of that period is the most logical and economical approach.
5. The “WIP Challenge”: Why it Troubles Accountants
While Work-in-Process (WIP) exists in Job Costing, it’s easily identified. In Process Costing, it becomes a headache because:
- The Conflict: The process flows continuously, but the accounting period “stops” abruptly.
- The Scenario: At the end of the month, the factory contains some 100% finished loaves of bread and some that are just raw dough (WIP).
- The Question: “How do we split the flour and electricity costs between the finished bread and the raw dough?”
- The Solution: Equivalent Units of Production (EUP). We treat 100 units that are 50% complete as being equal to “50 fully completed units” in terms of effort. This logic allows us to allocate costs fairly.
6. The Five-Step Procedure of Process Costing
To solve the WIP dilemma and find the precise average unit cost, global enterprises follow these five steps:
- Analyze Physical Flow: Verify the quantity of Beginning Inventory, Units Started, Units Completed, and Ending Inventory.
- Calculate Equivalent Units (EUP): Convert the unfinished WIP into its “Finished Unit” equivalent.
- Summarize Total Costs: Gather all costs incurred (Materials + Conversion Costs [Labor + Overhead]).
- Compute Cost per Equivalent Unit: Divide total costs by the EUP.
- Assign Costs: Allocate the costs to the Finished Goods and the Ending WIP.
7. Advantages and Disadvantages
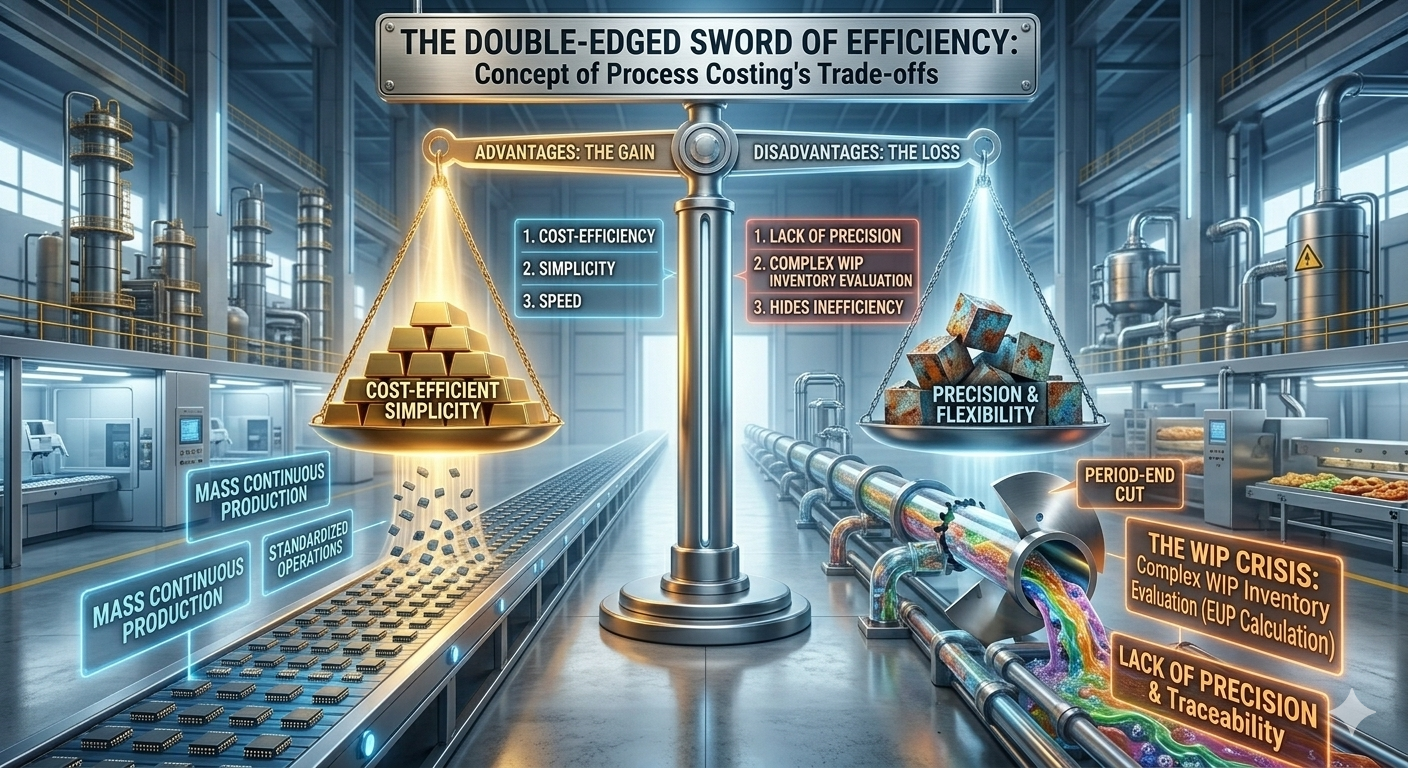
Because this method is used in mass-production industries (Chemicals, Oil, Food, etc.), it has distinct trade-offs.
1) Advantages
- Cost-Efficiency: No need to track every individual item, reducing administrative labor and overhead.
- Simplicity: Since the process is repetitive and standardized, cost accumulation is easy to automate.
- Speed of Information: Provides a quick overview of the average cost flow, helping management make rapid scale-based decisions.
2) Disadvantages
- Lack of Precision: Using averages may hide the actual cost of a specific batch or unit.
- Complex Year-End Valuation: The EUP calculation involves subjective estimates of “completion percentage,” which can introduce bias.
- Difficulty in Tracing Inefficiency: Because costs are averaged, it is harder to pinpoint exactly where waste or errors occurred in the pipeline.
8. Summary: Two Worlds of Costing
| Feature | Process Costing (The Science of Average) | Job Order Costing (The Art of Tracking) |
| Core Philosophy | Systems & Efficiency | Detail & Customization |
| Production Style | Mass Production (Continuous) | Customized Production |
| Cost Unit | Process or Department | Individual Job or Order |
| Data Source | Total Period Bills (The Lump) | Job Cost Sheets (The Individual Ledger) |
| Key Challenge | Logical Allocation of WIP | Simple Verification of Ledgers |
| Typical Industries | Oil, Food, Semiconductors, Paper | Construction, Aerospace, Legal, Films |
Conclusion: Key Takeaways
- Scale Requires Standardization: When you produce millions of items, tracking individual costs is a liability. Process Costing turns scale into a manageable science.
- The Magic of EUP: The Equivalent Units concept is the only way to fairly bridge the gap between “unfinished work” and “finished profit.”
- Average as a Strategy: Process Costing isn’t just about finding a number; it’s about monitoring the health of your entire manufacturing pipeline in real-time.
AI Disclosure: Created in collaboration with Google Gemini. All core content was authored, reviewed, and edited by the author.